Economic Updates
Stay up-to-date on economic conditions and outlook with our analysis and commentary.
Happy New Year – Wishing you and yours the very best for 2015!
 Throughout 2014 we were reminded that: markets are volatile; employment trends are ever-changing; food prices seem to continue to rise; diminishing energy prices can bolster the economy; the debt crisis in Europe appears to be on the mend; and returns are unpredictable.
Through all the hints of corrections, we were there with you; guiding and advising you. While we can’t know what the future holds, here’s a glimpse of what 2015 might bring on the financial front:
Market volatility will be ever-present and a consistent element of the new “normal,” given geopolitical tensions, varying reform agendas, and divided monetary policies across the globe. Within the first couple weeks of the year, the precipitous drop in the price of oil has caused major swings.
On the home front, the dollar has strengthened, and interest rates remain low setting the stage for the U.S. to continue to be a leader in 2015. Coupled with development in new technologies: mobility, cloud computing, and additive manufacturing, the country’s future looks bright!
We expect the Fed to have its first rate hike in 2015. While many of us have benefited from low interest rates, it is time for the central bank to tighten its belt. Janet Yellen and her team will be providing strict oversight to the gradual rollout.
We are excited for what 2015 has in store for us. We will continue to work hard for you and your family and to keep you abreast of the ever-changing world and investment arena.
As we welcome another New Year, we’re hopeful this one will be a great one for you; allowing you to continue to pursue your interests and live your dreams! We wish you the very best in health and happiness and look forward to seeing you at our upcoming client events throughout the year. From our family to yours, Happy 2015!
Economic Update – Fourth Quarter 2014
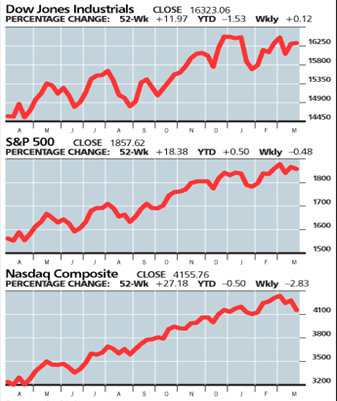
While market participants and forecasters had their share of surprises and disappointments in 2014, many investors were rewarded as U.S. stocks had a solid year overall. That was not the case for most bellwether international and emerging-market indexes.
The Dow Jones Industrial Average was up 7.5% in 2014 while the S&P 500 experienced its third straight annual increase of over 10%. These two major indexes outperformed the broader market—the NYSE Composite Index rose a little more than 4% for the year.
Perhaps one of the more telling signs for 2015 was that the bull rested on the last two days of the trading year. In fact, U.S. stocks took most of the last week of 2014 off, finishing more than 1% lower. This prompted many market analysts to predict that 2015 could bring a return to more volatility than investors experienced in 2014. The late drop was attributed to an absence of buyers, not a plethora of sellers. Dan Greenhaus, Chief Strategist at BTIG Research, said, “With volumes so low, you can’t read much into the action. The market’s inertia is up until something comes along to change it.”
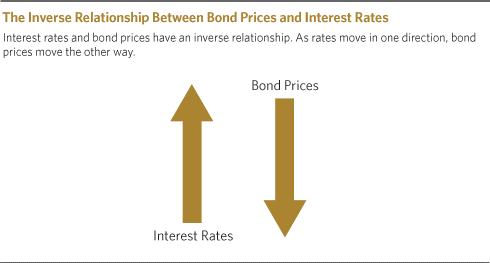
Bond investors also fared well in 2014. Most Wall Street professionals were off target as they predicted the government bond market to extend its selloff from 2013 and lead to higher interest rates. Thanks to slowing economic growth and declining inflation—especially in Europe—bond prices rose and yields fell.

2014 MARKET RETURNS (Source: yahoofinance.com)
Bonds were also helped when the Federal Reserve signaled that even though they ended their stimulus efforts, they were in no hurry to raise short-term interest rates. This added to the year’s bullish rally for income investors whose holdings were in government or investment grade bonds. Those who invested in sub-investment grade bonds did not fare as well. Russel Kinnel, director of manager research at Morningstar, said many non-traditional bond funds used wide mandates to bet on interest rates rising, “and that was not a great recipe for a year like 2014.” While income investors fared well in 2014, 2015 may look less attractive.
2014 was certainly a year to remember. Let’s review some notable highlights:
- January 31st – The New Year begins badly, as aftershocks from a sell-off in emerging markets hit the U.S.
- February 3rd – Leadership of the Federal Reserve passes to Janet Yellen, but Ben Bernake’s policies still rule.
- February 28th – Russian leader Vladimir Putin invades Crimea, sowing regional turmoil as the West shudders.
- July 3rd – First day the Dow Jones Industrial Average closes above 17,000.
- July 23rd – Oil prices peak at over $100 a barrel before sliding more than 40% in the second half to under $55.
- September 26th – Bond titan Bill Gross leaves Pimco for Janus, sparking huge redemptions at his old firm.
- October 31st – Bank of Japan’s Haruhiko Kuroda grabs the baton from the Fed and doubles down on monetary stimulus.
- November 4th – Republicans gain control of both the House and the Senate after midterm elections as a rebuke to President Obama.
- December 23rd – First day the Dow Jones Industrial Average closes above 18,000.
(Source: Barron’s, 12/2014)
 As we look back at 2014, analysts are citing that the U.S. economy is looking better. Financial experts are pointing to the fact that we are experiencing falling unemployment, rising stock prices and an uptick in housing starts. Although at first many predictions for 2014 were met with skepticism, it would be difficult to argue with the average strategists’ 2013 prediction for a 10% rally in 2014.
Looking Ahead to 2015
Although there are still some strong contrarians out there, the consensus for 2015 appears to be bullish. Many analysts are suggesting that the market will continue to rise based on many factors, including:
- The U.S. economy will continue to move forward in a reasonable manner
- Unemployment figures will continue to go lower
- The European economy will get better
- Japan’s recession will ease
- The Federal Reserve will raise the federal funds rates
- Stocks will remain attractive compared to U.S. Treasuries
Bob Doll, Senior Portfolio Manager and Chief Equity Strategist of Nuveen Asset Management, believes 2015 will be the year of “increasing belief.” In other words, 2015 could be the year that we feel better about the U.S. economy than we do about the stock market. Doll said, “I think the dichotomy between a mediocre U.S. economy and a really good, if not great, U.S. stock market has been the reason people have not gotten enthusiastic.” Doll predicts it will be a good economic year, with low inflation, consumer spending picking up, an improving job market, and a solid year of earnings growth. The biggest risk, however, is the risk of deflation outside the U.S., led by a decline in oil prices. (Source: WealthManagement.com, 1/2015)
While it’s easy for investors to want U.S. stocks to have another strong year in 2015, we still need to remember that the current bull market started in 2009. In fact, some analysts conclude that stocks are no longer cheap—and under certain financial metrics valuations, are high. According to Bloomberg, after gaining 10% in 2014, consensus earnings-per-share growth for U.S. corporations is expected at 8% in 2015.
While no one can predict the future, there seems to be agreement on which factors will most influence investment outcomes. Adam Parker, Chief U.S. equity strategist at Morgan Stanley, says that “everyone is talking about rates, the dollar and oil.”
Interest Rates
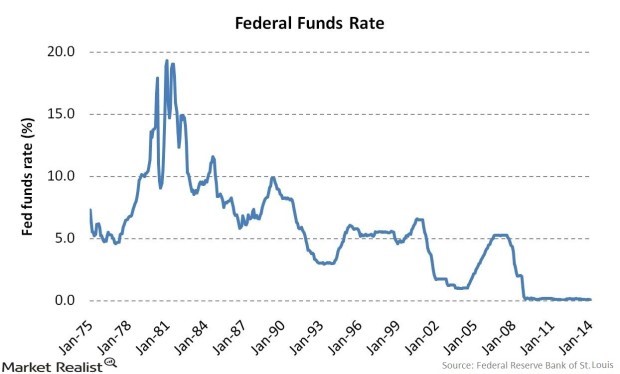
(Source: Wall street Journal 12/2014)
Interest rates will play a role for investors again in 2015. The Federal Reserve has already signaled that it plans to raise interest rates and phase out the easy money policies that were designed to stimulate the faltering economy from the 2008 financial crisis. Having said that, their timeline for doing so still remains uncertain and financial experts are split on whether interest rates will actually go up in 2015.
Jurrien Timmer, Director of Global Macro in Fidelity’s Global Asset Allocation Division, says that “Federal Reserve uncertainty could mean more volatility for investors. This is particularly true at the beginning of a rate cycle, when the market is trying to gauge the speed and magnitude of the Fed’s plans. Indeed, big questions remain as to whether the Fed will follow a carefully choreographed rate-normalization script in 2015 or whether it will be forced to speed things up or slow them down.”
Most analysts started 2014 with what they considered a can’t-miss notion that interest rates would rise. They fell. Again in 2015, many feel rates could rise. The Fed’s short-term policy affects other rates, but longer-dated bonds depend more on a variety of market-based factors. 2014 results proved those factors can overpower even talks of Fed policy changes. While a growing U.S. economy and a deteriorating European outlook should exert pressure on 30-year Treasury bond yields, inflation needs to pick up meaningfully before that yield can rise significantly. (Source: Barron’s, Dec.15, 2014)
Remember—in many cases, bonds are supposed to provide portfolios with stability and hopefully help against stock market swings. Conservative investors should not try to chase speculative returns in bonds.
In their 2015 Investment Outlook, Delaware Investments wrote, “We believe returns will be lower than they have been in recent years.” They say that bond investing “will be transitioning into a new reality, one in which return expectations ought to be tempered.”
Jeffrrey Gundlach, who oversees $64 billion dollars at DoubleLine and is often referred to as the King of Bonds, agrees with others that the Federal Reserve will begin to raise the federal funds rates this year. However, he also predicts that the result will be the opposite of conventional wisdom, with longer-term yields declining in 2015 and investors facing a flattening yield curve.
As financial professionals, we intend to be very watchful of both the Federal Reserve’s movements and interest rates this year. We would be glad to recheck your personal situation during your next review or at any other time.
 U.S. Employment
One of the barometers that the Federal Reserve looks to for direction is U.S. employment statistics. The unemployment rate, obtained from a separate survey of U.S. households, was 5.6% in December, down two-tenths of a percentage from November and its lowest level since June 2008. In December of 2014, U.S. employers added to payroll at a brisk rate. While economists surveyed by The Wall Street Journal had predicted that payrolls would rise by 240,000 in December, the actual number of non-farm payrolls rose to a seasonally adjusted 252,000 according to the Labor Department. This brought unemployment down to 5.6%.
Altogether, employers added 2.95 million jobs in 2014, the biggest calendar increase since 1999. Of course, the U.S. population has grown significantly in that time, to a population of more than 318 million in 2014, from 279 million in 1999. (Source: Wall Street Journal, 1/2015)
Oil Prices
Energy stocks have been among the year’s worst performers, as oil prices declined almost 50% from their mid-year peak of over $100 a barrel. 
Many investors are questioning if there are bargains in beaten-down energy shares. Some analysts see value, while others fear that oil prices still have to stabilize. Lower oil prices help consumers at the pump, but they can wreak real havoc on unemployment, capital spending, loan collateral values, energy-company balance sheets and the junk-bond market.
Jeffrey Gundlach alerts investors that “the boost to U.S. consumers from lower pump prices is the first shoe to drop, but the negative secondary effects from the crude-oil price lapse take longer to surface.” He also reminds investors that “when you have a market that showed extraordinary stability for five years—trading consistently at $90 a barrel or above—undergo a catastrophic crash like this one, prices usually go down a lot harder and stay down a lot longer than people think is possible.” (Source: Barron’s, 1/2015)
“It’s not clear that anyone can answer how low [oil prices] will go,” said Ed Morse, global head of commodities research for Citigroup Inc. He adds, “It’s always hard to call a bottom.” Oil prices and their fluctuations can create market disruption and uncertainty. Oil prices will be on the list of items that we will monitor in 2015. (Source: Bloomberg.com, 1/2015)
International Concerns
For many market strategists, the bullish case for equities includes a stronger European economy and the end of the current recession in Japan.  Like the U.S., Europe and Japan will benefit from lower oil costs. Their exports are currently cheaper because they have depreciating currencies andtheir borrowing costs are low. Most analysts feel that the European Central Bank will follow the Federal Reserve’s example and provide Quantitative Easing and an asset buying program. These measures allow the European Central Bank to bolster their countries’ money markets by making funds available for banks to borrow on more favorable terms. (Source: Barron’s, 12/2014)
Russia and China also present concerns for investors. Russia “is in bad shape, due to lower oil prices, but it wants to remain relevant on the world stage,” according to John Praveen of Prudential International Investment Advisors. He and others also caution that China will be another concern for forecasting markets in 2015. Investors will need to see if the Chinese central bank can provide sufficient stimulus to help their economy continue its expansion in 2015. (Source: Barron’s, 12/2014)
 U.S. Politics
As we head into 2015, the political landscape in the U.S. has changed dramatically. Following six years of gridlock and brinksmanship, 2015 could prove to be a very interesting one.
With Republicans taking control of both the House and the Senate, analysts are predicting an active year in Washington. Jason Furman, Chairman of President Obama’s Council of Economic Advisors, said, “There’s no reason why we can’t continue to have a strong economy in 2015” after coming off a year of solid economic performance marked by improvements in hiring, wages, and corporate investment. President Obama only has 24 months remaining—a short period of time for him to cement his legacy. Analysts feel that comprehensive tax reform, especially closing some loopholes and revamping corporate taxes, could prove to be a big win for investors. The U.S. political scene is another area investors need to pay attention to this year. (Source: Barron’s, 1/2015)
Conclusion: What Should an Investor Do?
Although the U.S. stock market isn’t filled with bargains, most analysts see the potential for U.S. stock market gains in 2015. Jurrien Timmer, Director of Global Macro in Fidelity’s Global Asset Allocation Division, encourages investors to “continue to view the U.S. market as the best house on the street. As we all know, the best house is usually the most expensive, and for good reason.” While many analysts are predicting growth for U.S. stocks, that growth might not come easily. In the last three years the S&P 500 has risen from a humble 11.7 times next-four-quarter earnings estimates to an ambitious 16.5 times. Investors might be best served structuring their portfolios to weather stock market turbulence. (Source: Barron’s, 12/2014)
 Some analysts expect that the Fed might raise the short-term federal funds rate at mid-year, but not enough to destroy any good times for investors. Columbia Management’s Barry Knight reminds investors that “the case for higher interest rates is a little stronger than last year’” and he feels that getting the Fed’s moves right is the single most important factor in making an accurate market prediction for 2015.
So what can investors do?
Continue to be watchful. Perhaps some of the optimism can be attributed to holiday cheer; however, even the most optimistic need to be aware of some of the warning signs.
Long term investors should try to not change their outlooks based on short-term market forecasts. It might be in your best interest to prepare your portfolio for turbulence and focus on risk. Two of the questions investors need to ask themselves are:
- How much risk do I pose to my portfolio?
- How much risk do I need to take?
These are great starting places for investors for 2015. Generic and non-specific advice might not be best during volatile and confusing times.
Focus on your own personal objectives. During confusing times it is always wise to revisit your personal timelines. It is typically in your best interest to create realistic time horizons and return expectations for your own personal situation and to adjust your investments accordingly. For example, it’s important to consider your time horizon when looking at an investment. If you will need more cash flow from your investments over the next one to five years, you might consider different choices than someone with a ten-to-fifteen-year time horizon.
Understanding your personal commitments and categorizing your investments into near-term, short-term and longer-term can be helpful. We are skilled at this and are happy to help you.
Be cautious with income investments. While some income investors did well in 2014, this year the menu is less attractive. With the Federal Reserve and interest rates in the spotlight, this is a good time to understand your true income and cash flow needs. Again, this is one of our strengths and we are happy to provide you with help. To review your situation, either call our office or wait for your next review.
Don’t try to predict the market. Investment decisions driven by emotion can cause problems for investors. Vanguard Investments reminds us that in the face of market turmoil, some investors may find themselves making impulsive decisions or, conversely, becoming paralyzed, unable to implement an investment strategy or to rebalance a portfolio as needed. (Source: Vanguard.com, 2014)
Discipline and perspective can help investors remain committed to their long-term investment programs through periods of market uncertainty.
Discuss any concerns with us.
Our advice is not one-size-fits-all. We will always consider your feelings about risk and the markets and review your unique financial situation when making recommendations.
We strongly believe it is prudent for investors to work with an advisor who offers constant communication and frequent discussions, as well as one who is continually reviewing economic, tax and investment issues and drawing on that knowledge when offering direction and strategies to their clients.
We pride ourselves in offering:
- consistent and strong communication,
- a schedule of regular client meetings, and
- continuing education for every member of our team on the issues that affect our clients.
A good financial advisor can help make your journey easier. Our goal is to understand our clients’ needs and then try to create a plan to address those needs. We continually monitor your portfolio. While we cannot control financial markets or interest rates, we keep a watchful eye on them. No one can predict the future with complete accuracy, so we keep the lines of communication open with our clients. Our primary objective is to take the emotions out of investing for our clients. We can discuss your specific situation at your next review meeting or you can call to schedule an appointment. As always, we appreciate the opportunity to assist you in addressing your financial matters.
Note: The views stated in this letter are not necessarily the opinion of FSC Securities Corporation, and should not be construed, directly or indirectly, as an offer to buy or sell any securities mentioned herein. Investors should be aware that there are risks inherent in all investments, such as fluctuations in investment principal. With any investment vehicle, past performance is not a guarantee of future results. Material discussed herewith is meant for general illustration and/or informational purposes only, please note that individual situations can vary. Therefore, the information should be relied upon when coordinated with individual professional advice. This material contains forward looking statements and projections. There are no guarantees that these results will be achieved. There is no guarantee that a diversified portfolio will outperform a non-diversified portfolio in any given market environment.
All indices referenced are unmanaged and cannot be invested into directly. Unmanaged index returns do not reflect fees, expenses, or sales charges. Index performance is not indicative of the performance of any investment. Past performance is no guarantee of future results. The Standard and Poors 500 index is a capitalization weighted index of 500 stocks designed to measure performance of the broad domestic economy. Through changes in the aggregate market value of 500 stocks representing all major indices. The Dow Jones Industrial average is comprised of 30 stocks that are major factors in their industries and widely held by individuals and institutional investors.
Due to volatility within the markets mentioned, opinions are subject to change without notice. Information is based on sources believed to be reliable; however, their accuracy or completeness cannot be guaranteed.
In general, the bond market is volatile, bond prices rise when interest rates fall and vice versa. This effect is usually pronounced for longer-term securities. Any fixed income security sold or redeemed prior to maturity may be subject to a substantial gain or loss.
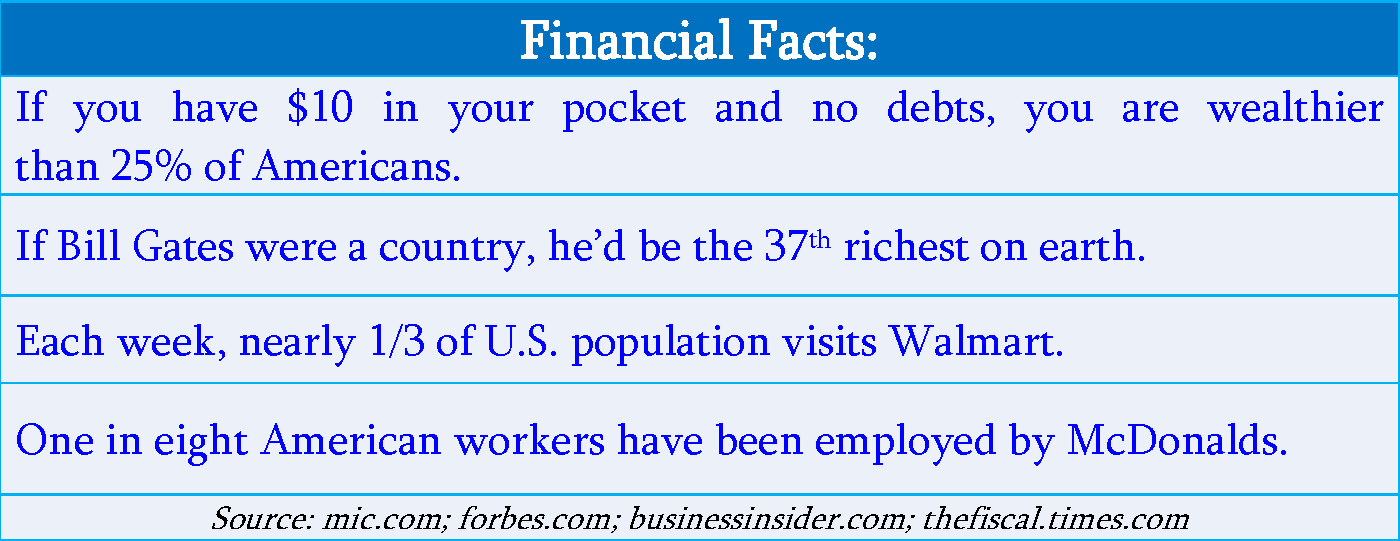
Sources: yahoo.com; Wall Street Journal, Barron’s; WealthManagement.com; Bloomberg.com; mic.com; forbes.com; businessinsider.com; thefiscal.times.com
© Academy of Preferred Financial Advisors, Inc.
Volatility Is Up. So What?
Professional investors know something that most people find impossible to believe: that the threat of scary ups and downs in the markets is by far the best friend of the long-term investor. Why? Because over the long term, stocks have provided returns far higher than bonds or cash. If it weren’t for the occasional dizzying gyrations, any rational investor would put his or her money where the highest returns have been. Right?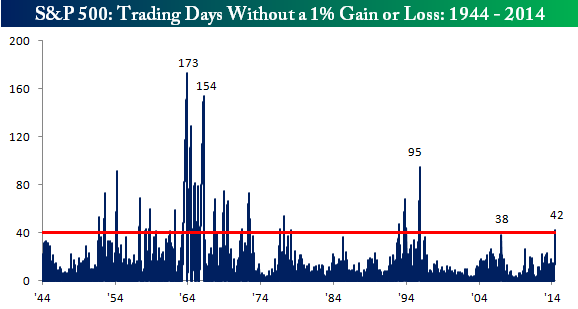
This appears to be one of those times–a time when non-professional investors are reminded of the reasons why they have this lingering fear of the stock market. Since the end of September, the S&P 500 index has done something regularly that it normally does infrequently: moved more than a full percent up or down in a single day. Consider the recent pattern this month:
- Oct. 1 -1.3%
- Oct. 4 +0.05%
- Oct. 5 +1.1%
- Oct. 6 -0.2%
- Oct. 7 -1.5%
- Oct. 8 +1.8%
- Oct. 9 -2.1%
- Oct. 10 -1.1%
- Oct. 13 -1.65%
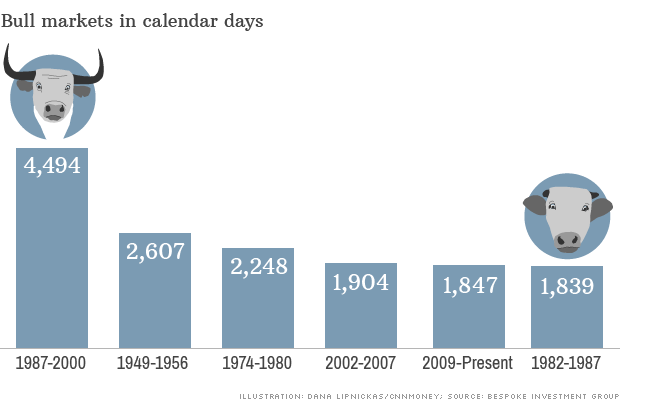
Contrast this to the calm before the storm: earlier this year, the markets experienced 42 consecutive days without a single 1% price move, and the accompanying chart shows that this is far from the record.
The question we should be asking ourselves is: why are we paying such close attention to daily market movements? Why are we allowing ourselves to fall for the trap of getting anxious over short-term swings in stock prices?
The second chart shows the growth of a dollar invested in the S&P 500 at the beginning of 1950, with dividends reinvested, compared with a variety of alternative investments which have not provided the same returns. (Note that small cap stocks, which are more volatile, have done even better.) The chart also shows all the scary headlines that the markets managed to sail through on the way to their current levels–all of which are scarier than the things we’re reading about today.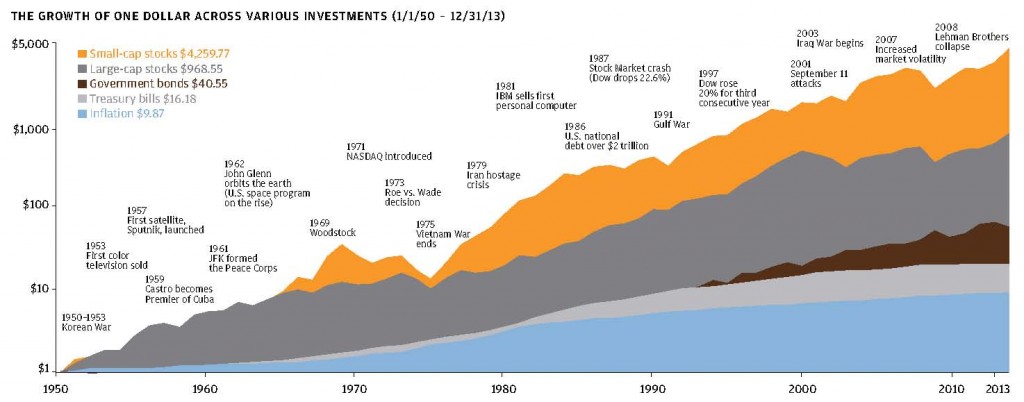
This is not to say that the markets won’t go lower in the coming days, weeks or months; in fact, we are still awaiting that correction of at least 10% which the markets delivery with some regularity on their way to new highs, which has been long-delayed in this current bull market. The thing to remember is that the daily price of your stock holdings are determined by mood swings of skittish investors whose fears are stoked by pundits and commentators in the press, who know that the best way to get and hold your attention is to scare the heck out of you. What they don’t say, because it’s boring, is that the value of your stock holdings are determined by the effectiveness of millions of workers who go to work every day in offices and factories, farms, warehouses, power plants and research facilities, who slowly, incrementally, with their daily labor, build up the value of the businesses they work for.
The last time we checked, that incremental progress hasn’t stopped. The economy is still growing. You won’t get a daily report on the value of the stocks you own; only the daily, changing opinions of skittish investors. But if you take a second look at the growth of an investment in stocks over the long-term, you get a better idea of how that value is built over time, no matter what the markets will do tomorrow.
Sources: http://www.bespokeinvest.com/thinkbig/2014/6/17/1-moves.html
Economic Update – Third Quarter 2014
The third quarter of 2014 was very interesting. The overall results for many investors were positive, but while several diverse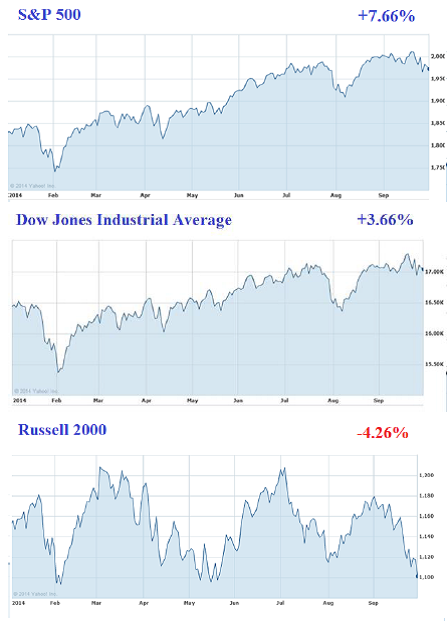 pockets of the market enjoyed gains, other stocks struggled. The S&P 500 and the DJIA (both of which track larger established companies) continued to outperform small stocks and foreign shares. Through Sept 30, 2014 the S&P 500 was up 7.66% and the DJIA was up 3.66%. By comparison, the Russell 2000 Index (which tracks small stocks) is down 4.26% for 2014. (Source: Wall Street Journal)
Many analysts feel that several U.S. big stocks are still more attractively priced than smaller stocks and that this trend could continue. “Small stocks are victims of their own success,” according to Jack Ablin, Chief Investment officer of BMO Private Bank. “They made a huge move last year and entered into this year overvalued. While there are great small company stocks, small caps in general need to take a back seat to their larger competitors until valuations come back into alignment.” In fact, some portfolio managers are fearful that the small cap underperformance has just begun. (Source: Wall Street Journal 9/29/2014)
Although caution still remains the top priority for most investors, many analysts feel that the bull could stay in charge for the rest of this year and possibly longer. Barron’s surveyed 10 top analysts in September and surprisingly, all of them felt that the upward trend would continue. While several analysts toned down their optimism because of the market’s gains, they still feel that we have not reached the market’s ultimate peak. They feel that rising corporate profits will continue to lead to increases in large cap stock prices. Having said this, they still caution investors about political tensions and interest rates. (Source: Barron’s 9/8/2014)
In a recent Interview, Dirk Hofschire, Senior Vice President of Asset Allocation Research at Fidelity Investments, said, “We continue to have a favorable global backdrop for asset prices. It’s been a Goldilocks environment where things are not too fast, not too slow, not too warm, not too cold. The U.S. economy has still been making progress, jobs are being created, unemployment is coming down and many leading indicators still point up.” (Source: Fidelity.com)
Investors are still keeping a watchful eye on the Fed—its bond buying program is set to end in October and many investors expect the Fed to raise interest rates sometime next year.
Recently, volatility has returned to the market and investors are noticing a “see-saw” effect between the bears (who are convinced stock prices will fall) and the bulls (who rush in during market swings to selectively add to their equity positions). Who is right? Only time will tell!
MONETARY POLICY
Many investors are watching the Federal Reserve very closely and with good reason. The Fed’s September bond purchases were only $15 Billion and in October they are moving towards their pledge to end the Quantitative Easing program of buying bonds. This is leaving many analysts concerned about the upward movement of interest rates. The Fed’s key interest rate target has been pinned at virtually zero since December 2008 (the depth of the financial crisis).
This is not the first time that the Federal Reserve has taken a “whatever it takes” approach to supporting monetary policy. Thirty-five years ago on October 6, 1979, 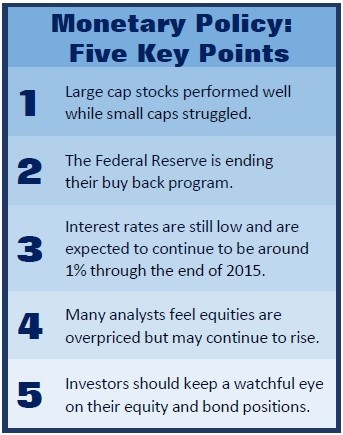 the Federal Reserve, led by Paul Volker, made a revolutionary change in how it handled monetary policy. Faced with double-digit inflation rates, the central bank responded by raising interest rates to 20%. Although this caused other aftershocks, this extreme policy would go on to tame inflation rates. (Source: Barrons 10/6/2014)
Monetary policy has had a key impact on the world’s major economies. Investors are rightly concerned about how effective monetary policy can be given the fact that central bankers have cut rates just about as much as they can.
According to Matthew Coffina at Morningstar research, “interest rates have been one of the biggest surprises of the year. Going into 2014, most pundits expected a steady rise in interest rates as the Federal Reserve winds down its purchases of long-term bonds and moves closer to raising short-term rates. Instead, the yield on the 10-year Treasury fell from 3% at the start of the year to a low of 2.34% in mid-August. The 10-year Treasury yield has since recovered to around 2.6%, but it remains below where many market observers had expected.”
Today, as the Fed prepares to wind down its extraordinary Quantitative Easing policy, interest rates are still close to zero. The consensus among analysts is that we are still about a year or so away from the Fed’s first interest rate hike, or tightening of the cycle. The Federal Reserve faces a delicate few months ahead amid internal debates over when to start raising interest rates and how to adjust its public guidance about its likely actions. The Fed and its current leader, Janet Yellen, have been clear in communicating that even when they get to that first tightening, they will probably go pretty slow in raising interest rates.
Many investors are still searching for safe, short-term debt. This demand intensified at the end of the quarter, pushing up bond prices and forcing down yields. The yield on the US Treasury bill on September 2nd reached a negative .01%. (Source: Wall Street Journal 9/24/2014)
During periods of market anxiety, Treasury Bonds can provide a safe harbor for many investors. So what should Bond investors do? Should they sit back and watch the data and refrain from taking any long term positions?
The entire bond market suffered when interest rates rose last year. If the Fed changes rates it could affect shorter dated bonds. Russ Koesterich, Chief Investment Strategist at Blackrock, warns to be careful with even two to five year Treasury bonds. (Source: Barron’s 9/1/2014)
While bonds are an important part of many financial plans, this is a good time to be very watchful of all income-oriented investments. Interest rates have remained at historically low levels for quite some time. Global rates continue to remain exceptionally low and that typically reduces the risk of a swift upward movement in U.S. interest rates.
Recent employment reports painted a brighter picture of the U.S. economy, but they also showed stagnant workers’ wages. Without rising incomes, the Fed seems to be less worried about inflation. That means that even though the jobless rate has hit a level at which the Fed might otherwise consider raising interest rates, it is no longer under the inflation gun when it comes to timing. (Source: Barron’s 10/6/2014)
It is anyone’s guess when the Fed will raise interest rates and by how much. On a positive note, Federal Reserve Chairperson Janet Yellen stated that she sees interest rates continuing around 1% until the end of 2015.
PRICE–TO–EARNINGS RATIO
Price-to-earnings (P/E) ratios are still a key factor in the valuation of equities for many analysts. P/E is a valuation ratio of a company’s current share price (market value) compared to its per-share earnings. For example, if a company is currently trading at $40/share and earnings over the last 12 months were $2/share, the P/E ratio for the stock would be 20 ($40/$2). Generally a high P/E ratio means that investors are anticipating higher growth in the future.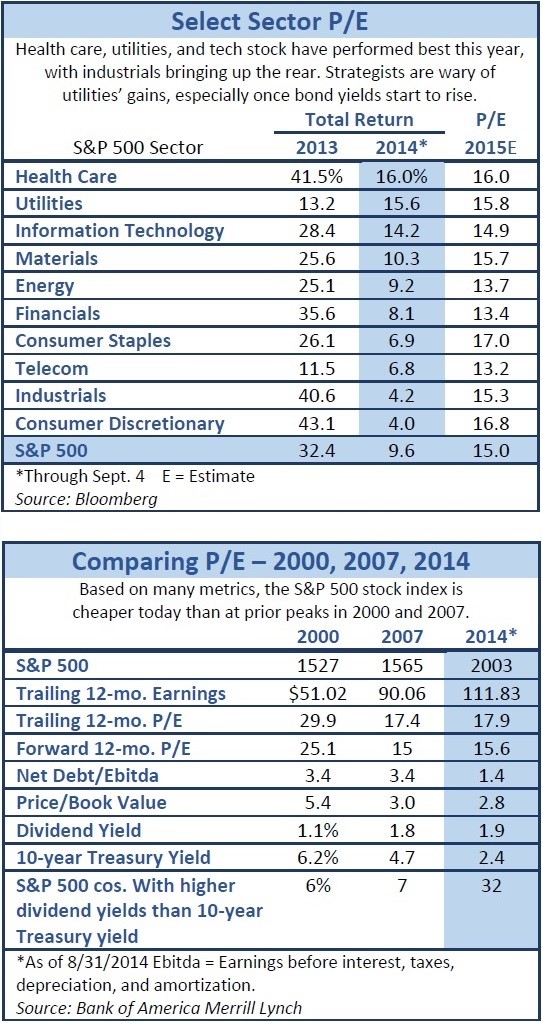
According to a Barron’s survey in September, P/E ratios were one of the main criteria used by 10 top analysts to measure equity valuations. They felt that with macroeconomic data improving and profitability broadening out, a case could be made that the market’s P/E ratios were extended but not outrageous. They viewed U.S. stocks as neither cheap nor expensive, considering the low level of interest rates. “Stocks offer less compelling value than a few years ago,” says Savita Subramanian, head of U.S. Equity and Quantitative Strategy at Bank of America Merrill Lynch. “But if anything, there’s an upside risk to my view.” (Source: Barron’s 9/1/2014)
Steven Auth, Chief Investment Officer of Federated Investors, is more bullish. “The U.S. economy is accelerating and so are earnings,” he said, adding that his market views have been right on for the past two years. (Source: Barron’s 9/1/2014)
However, John Campbell, a Harvard economist who collaborates with Robert Shiller (a Nobel laureate in economics who is also a noted P/E watcher) feels that based on today’s P/E measurements, stocks are overpriced. (Source: New York Times)
While the P/E ratio can be informative, you can see that not even the experts always agree on what it means. It is therefore important not to base a decision on this measure alone. When the denominator in this equation (earnings per share) shrinks, the actual numbers can change significantly.
STOCK BUYBACKS
Once again in the third quarter, corporate managements preferred to put their cash to work by purchasing their own stock. Reducing the number of outstanding shares raises the earnings per share. To the extent that corporate executives are compensated with stock, this can enhance their stakes. Many analysts presume that the decision to buy back stock is fueled by analyses that suggest that stock buybacks yield a better return than investments in expanding the businesses.
THE ECONOMY
Positive economic news during this quarter included the following:
- The U.S. labor market is improving at a faster rate, though gains remain slow enough to avoid provoking broad-based, late-cycle wage inflation. Year to date, the economy has added 1.6 million jobs—the 1.9% year-over-year increase in July was the fastest pace of growth since 2006.
(Source: Bureau of Labor Statistics)
- Core consumer inflation has slowed to 1.9% year over year. (Source: Fidelity.com)
- Personal consumption is still growing at a relatively modest 4% (nominal) year-over-year pace. (Source: Bureau of Economic Analysis, Haver Analytics)
In addition to this good news, of course, there were still some concerning factors. The main one was the housing sector, which remains in a soft patch, even though leading indicators are showing signs of slow improvement. Sales activity remains at historically weak levels and prices have flattened over the past three months. Construction starts and permit issuance remain at low levels, though they rose in July and remain in an upward trend. (Source: Core-Logic, Haver Analytics)
Although mortgage credit remains relatively tight during this quarter, banks reported the broadest rise in more than 20 years in their willingness to make residential loans during the second quarter.
GLOBAL OUTLOOK
Although differences vary wildly across the globe, overall economic developments outside the U.S. appear to be moving slowly and carefully.
Eurozone growth has idled due to GDP reductions in their two largest economies—Germany and France. However, analysts believe this might be a mid-cycle slowdown instead of the start of a new recession. Bank lending standards have eased up across the board and the European Central Bank has indicated a desire to help beyond the monetary stimulus plans already announced. The rate of growth is likely to remain low, with about 60% of the region’s economies experiencing expansion in their leading economic indicators during the past six months, down from 90% at the start of 2014.
Japan’s outlook remains ambiguous. Due to April’s tax hike, they recently underwent a worse-than-anticipated 19% annualized contraction in second quarter consumer spending. With the tax hike over, consumption should stay stable. Economic indicators have improved, but they still remain below the levels seen before the tax increase.
China, on the other hand, continues to benefit from their second quarter stimulus. However, leading indicators are exposing the diminishing returns that these policy decisions can provide and any return to expansive growth remains questionable. China’s property sector has been persistently plagued by falling housing prices and rising inventories and continues to be the largest near-term risk for economic and financial stability.
Across other developed markets, conditions vary drastically. Countries such as Indonesia and India seem to have benefited from the global stabilization after the interest rate shudder in 2013. Elections of perceived reformers have also seemed to add optimism back into their respective economies. Other emerging markets, such as Brazil, have been hindered by recessionary conditions. The weak global situation and diminishing commodity prices continue to challenge many developing countries. However, this significant variation among the world’s economies is still pushing the global business cycle into a slow upward trend.
INFLATION
The rate of inflation is something that is always monitored by the Fed and investment professionals. As mentioned earlier, inflation appears to be under control. However, it is important to remember that this number (which excludes food and energy) rose at its fastest pace in 15 months. (Source: Barron’s 6/23/2014)
Currently inflation isn’t high enough to cause much damage to the stock market, says Ned Davis of Ned Davis Research. He notes that since 1925, the S&P 500 has dropped 5% a year on average, when the inflation rate has exceeded the S&P500’s yield by more than 2.1 percentage points. While May’s 2.1% inflation rate was higher than the S&P 500’s 1.9% dividend yield, it’s in a range where shares have historically produced positive returns. (Source: Barron’s 6/23/2014)
Many investors are also concerned that inflation might start to decrease dramatically and actually cause a very unusual dilemma: deflation. This has already taken hold in many different European countries. The European Central Bank cut interest rates significantly and stimulated bank lending—moves that were specifically aimed at reversing this trend before other countries might encounter this problem. (Source: Wall Street Journal 6/6/2014)
CONCLUSION
Volatility seems to have returned to the equity markets and past 4th Quarters have seen their share of market swings. Analysts are focused on earnings, the Fed, the economy and stock valuations. However, individual investors still have to look at their own situations first. It is important to be cautious, but it is just as important to determine your own personal risk or “worry” level. That’s where we can help.
Now is good time to ask yourself:
- Has my risk tolerance changed?
- What are my investment cash flow needs for the next few years?
- What is a realistic return expectation for my portfolio?
Your answers to these questions will govern how we recommend investment vehicles for you to consider. We can help you determine which investments to avoid and how long to hold each of your investment categories before making major adjustments. For example, if your cash flow needs have changed for the next few years, you might consider different investments than someone who has limited to no cash flow needs.
We continually review economic, tax and investment issues and draw on that knowledge to offer direction and strategies to our clients.
We pride ourselves in offering:
- consistent and strong communication,
- a schedule of regular client meetings and
- continuing education for our team on the issues that affect our clients.
A good financial advisor team can help make your journey easier. Our goal is to understand our clients’ needs and then try to create a plan to address those needs. We continually monitor your portfolio. While we cannot control financial markets or interest rates, we keep a watchful eye on them. No one can predict the future with complete accuracy, so we keep the lines of communication open with our clients. Our primary objective is to take the emotions out of investing for our clients. We can discuss your specific situation at your next review meeting, or you can call to schedule an appointment. As always, we appreciate the opportunity to assist you in addressing your financial matters.
P.S. Under normal conditions, Fed tightening wouldn’t be too much of a worry. Since 1983, the Standard & Poor’s 500 Index has averaged a 4.4% gain during the 6 months before a hike and another 7.7% during the six months following it, according to Strategic Research Partners. The only problem: These aren’t normal times!

Note: The views stated in this letter are not necessarily the opinion of FSC Securities Corporation, and should not be construed, directly or indirectly, as an offer to buy or sell any securities mentioned herein. Investors should be aware that there are risks inherent in all investments, such as fluctuations in investment principal. With any investment vehicle, past performance is not a guarantee of future results. Material discussed herewith is meant for general illustration and/or informational purposes only, please note that individual situations can vary. Therefore, the information should be relied upon when coordinated with individual professional advice. This material contains forward looking statements and projections. There are no guarantees that these results will be achieved. There is no guarantee that a diversified portfolio will outperform a non-diversified portfolio in any given market environment.
Due to volatility within the markets mentioned, opinions are subject to change without notice. Information is based on sources believed to be reliable; however, their accuracy or completeness cannot be guaranteed. The P/E ratio (price to earnings ratio is a measure of the price paid for a share relative to the annual net income or profit earned by the firm per share. It is a financial ratio used for valuation: a higher P/E ratio means that investors are paying more for each unit of net income, so the stock is more expensive compared to one with lower P/E ratio. All indices referenced are unmanaged and cannot be invested into directly. Unmanaged index returns do not reflect fees, expenses, or sales charges. Index performance is not indicative of the performance of any investment. Past performance is no guarantee of future results. The Standard and Poors 500 index is a capitalization weighted index of 500 stocks designed to measure performance of the broad domestic economy. The Dow Jones Industrial average is comprised of 30 stocks that are major factors in their industries and widely held by individuals and institutional investors. In general, the bond market is volatile, bond prices rise when interest rates fall and vice versa. This effect is usually pronounced for longer-term securities. Any fixed income security sold or redeemed prior to maturity may be subject to a substantial gain or loss.
Sources: Barron’s; New York Times; Core-Logic-Haver Analytics; Bureau of Economic Analysis-Haver Analytics; Fidelity; Bureau of Labor Statistics; Wall Street Journal; HSH.com; Contents © 2014 Academy of Preferred Financial Advisors
Economic Update – Second Quarter 2014
The year’s first half for equities can be summed up in simple terms: confusing and unpredictable markets produced gains. As of June 30, the S&P 500 had already logged 22 record highs this year alone, ending the first half up 6% while the Dow Jones Industrial Average (DJIA) increased by 1.5%. Both of these indexes hit new highs in the 2nd quarter while the NASDAQ Composite index rose by 5.5%, reaching a 14-year highpoint. Interestingly, 2014 has produced the biggest halftime lead by the S&P 500 over the DJIA since 2009 and the seventh-biggest since 1929, according to Bespoke Investment Group.
Bespoke also shared that in eight of the 10 years with the most underperformance, the DJIA has gone on to outperform the S&P 500 during the second half of the year. If this pattern holds, then the Dow might make up some of that lost ground. (Source: Barron’s, June, 2014)
Investors started 2014 with several serious concerns that were enough to make them nervous. How would the S&P 500 Index follow up 2013’s 30%+ gain (including dividends)?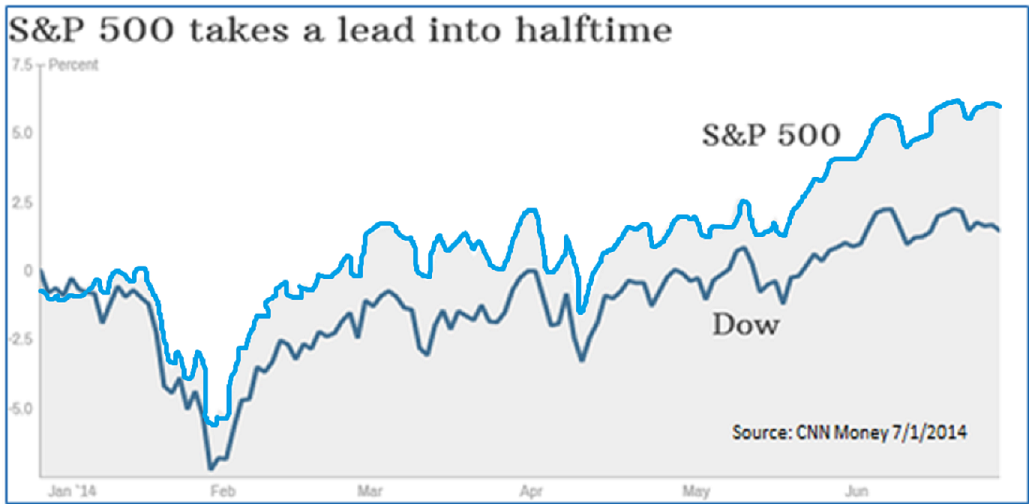 Would the market correct because the bull was getting tired, or would there be profit-taking? Would the slow improvement in the U.S. economy send bond prices lower, or would we see the Federal Reserve shift to higher interest rates? All of these fears made investors nervous.
So far in 2014, the bond market has also fared well—in fact, better than most had expected. The yield on the U.S. Treasury ten-year note, which moves inversely to its price, fell to 2.51% from 2.76% at the end of the first quarter.
Unfortunately, many investors are having a hard time enjoying these increases, as concerns about lofty prices make it difficult to decide whether to keep funds in cash or stay invested. The forces driving the stock market to new highs and helping parts of the bond market to remain near record low yields don’t show immediate signs of changing.
What are the forces driving the rallies in both stocks and bonds? Many economists credit the aggressive efforts by the world’s major central banks to flood financial markets with new money in an effort to keep sluggish economies continually moving forward.
U.S. stocks have been supported by expectations that the U.S. economy, while still sluggish, will grow fast enough to keep corporate profits expanding. However, many investors no longer feel comfortable with that outlook, and have begun focusing more on what can go wrong with their portfolios than on where they can make money.
The current stock market rally has outlasted the historical average of other Bull Markets with higher returns. In contrast, the preceding Bear Market was much steeper and longer than average, and the gains from the period—from the beginning of the Bear Market to the end of this Bull Market—are currently near the median and below the average. This confusion can be why many investors are proceeding with great caution. (Source: Fidelity)
There is “still a bit of a fear-factor” among investors, said Thomas Huber, Manager of the T. Rowe Price Dividend Growth Fund. “Everyone is looking for what’s going to be the big crack in the markets.” (Source: Wall Street Journal, July 1, 2014)
While many investors are concerned about how markets will respond when the Fed raises interest rates in the future, there are also concerns building in the opposite direction regarding the estimate in the growth of our economy. The Commerce Department’s third and final estimate of the Gross Domestic Product (GDP) for the first quarter of 2014 continued the downward spiral of the first two estimates—from +0.1% to -1.0%, and now down to -2.9%. This was the largest drop recorded since the end of World War II that wasn’t part of a recession.
Many economists believe that the extent of the first quarter decline is so substantial that it makes it unlikely that we will reach a 2% increase, even if the next three quarters are significant. (Source: Bob LeClair’s Finance, June 28, 2014)
Early in the year, stocks ran into problems and investors blamed the harsh winter weather in large parts of the country. Several early indicators led to speculation that the economy was weakening, but in the 2nd quarter the market rebounded, sparked by thoughts that better growth was leading winter into spring. So far, those thoughts have proved to be accurate: the U.S. economy has improved, although there are still concerns over how strong the rebound will be.
A recent GDP report offered some positive data, including:
- Existing-home sales climbed 4.9%, the strongest gain in three years.
- New-home sales jumped 18.6% in May (the largest gain in more than 20 years) to an annual rate of 540,000 units, a six-year high. The median price for a new home also increased almost 7% from last year.
- The Conference Board’s confidence index improved to 85.2 in June. That was its highest reading since 2008, as many consumers were more optimistic about jobs and future conditions. (Source: Bob LeClair’s Finance, June 2014)
Will we be able to hold onto these gains and add enough through the end of the year to at least have a positive GDP for 2014? Let’s hope so. Slow growth could reduce corporate profits, which would be bad news for stocks and could lead to higher-than-expected default rates on junk bonds.
PRICE–TO–EARNINGS RATIO
Price-to-earnings (P/E) ratios have risen over the last two years, as improving investor confidence helped drive market gains. Some are focused on the current valuations which are slightly above the long-term average, 17.1 versus 15.1. The higher the P/E, the more likely the stock market is overpriced. Although most stock indices are at an all-time high, the market valuation is nowhere near its 2001 peak. (Source: Fidelity.com)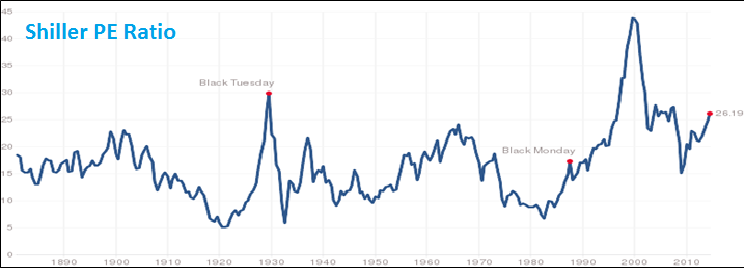
Even with a gain in the first half of 2014, bears exist. Nobel Prize-winning professor Robert Shiller notes that currently the market looked more expensive on a cyclically adjusted price/earnings basis only three other times in the past 130 years—1929, 2000 and 2007. The Shiller P/E ratio for the S&P 500 is based on average inflation-adjusted earnings from the previous 10 years. Despite this statistic in today’s low interest rate environment, Shiller is not telling investors to sell all of their holdings and to retreat to a bunker. He just thinks it might be time to be cautious and lighten up.
STOCK BUYBACKS
Many investors do not realize that one of the stock market’s biggest drivers today is stock buybacks. Companies buying back their own shares represent the single biggest category of stock buyers today, according to a study by Jeffery Kleintop, Chief Market Strategist at LPL Financial. (Source: Wall Street Journal, June 30, 2014)
Stock buybacks are also a source of controversy. Some economists say they allow companies to provide artificial support for stock prices by increasing demand for shares. Also, if a company reduces its number of shares, simple math shows that the earnings per share will rise even if the total earnings go nowhere. Most professional money managers look primarily at earnings per share, so buybacks can improve a company’s apparent earnings performance, even if overall earnings aren’t rising at all. Executives may use buybacks to manipulate share prices, helping them hit earnings targets, receive bonuses, and other benefits.
According to Mr. Kleintop, half of the first quarter’s S&P 500 per-share earnings gains came from declining share count, not from increases in actual earnings. (Source: Wall Street Journal, June 30th)
That doesn’t mean all buybacks are misguided, he added. In some cases, buybacks are better than dividends as a way to return money to shareholders because investors pay taxes on dividends and don’t pay taxes on buybacks unless they sell their shares.
GLOBAL
Financial markets worldwide are getting a boost from recent upbeat economic data out of China that is improving the outlook for global growth. China has increased its manufacturing activity and many economists believe that its appetite for raw materials will continue.
Many markets were rattled earlier this year by worries that China’s slowing growth would lead to a hard landing. However, the Chinese government has taken various measures to build investor confidence, including credit easing, more spending on highways, and business tax breaks.
After a massive credit boom in recent years, China continued to struggle to balance the competing objectives of tapering down its excessive credit expansion, preventing financial instability, and maintaining a fast pace of growth. Foreign capital inflows have risen and become more short-term in nature, increasing China’s vulnerability to shifts in global capital flows. (Source: Fidelity)
The U.K. and Germany remain the primary drivers of the European Economic Expansion, but there have now been indicators that other European economies have improved significantly, suggesting that Europe’s cyclical upturn continues to become more broad-based.
INTEREST RATES
Central bankers around the world debate whether very low interest rates, adopted in many economies since the 2008 financial crisis to spur stronger recoveries, are actually feeding market bubbles that could burst and potentially cause new financial turmoil. In June, Mario Draghi, President of the European Central Bank (ECB), made a bold move by cutting the main lending rate from 0.25% to a record low 0.15%. This pushed the deposit rate from zero to a minus 0.1%, effectively charging banks to park funds at the central bank. Following that move, Mr. Draghi said, “Are we finished? The answer is no. If need be, within our mandate, we aren’t finished here.” (Source: Barrons, June 2014)
The Fed has held short-term interest rates near zero since late 2008 and is winding down its bond-buying program. Recently, Janet Yellen, Chairperson of The Federal Reserve, assured investors and the public that the Fed won’t raise interest rates abruptly simply because some markets may look a bit volatile. The Fed has taken pains to reassure investors that interest rates will remain low even as the economic recovery picks up. (Source: Wall Street Journal, July 3, 2014)
Most Fed officials have indicated they expect to start raising interest rates in 2015, but the final decision will depend on whether the economy continues to strengthen as they forecast. The Fed has also stated that when it actually does increase rates, it will do so gradually and short‑term interest rates are unlikely to rise as high as they have in previous recoveries.
Many investors think that the rise in interest rates could happen sooner than the Fed’s estimate and the pace of increases could be more rapid than currently expected.
Historically, low interest rates and strong profitability have allowed U.S. corporations to reduce interest expense, improve their balance sheets, and accumulate liquid assets. Companies have used high cash balances to return capital to shareholders as both dividends and share buybacks, maintaining relatively high yield even though equity prices have continued to rise.
INFLATION
Inflation finally nudged above the 2% level that the Fed says is its long-term target. Compared with a year ago, the Consumer Price Index (CPI) is up 2.1% (not including food or energy). Although that might make the Fed happy, it sent a tremor of worry through analysts, investors, and economists.
Ongoing weak wage growth has continued to eliminate inflationary pressures in many developed economies. Weaker economic outlooks may help bring down inflation in some emerging markets’ economies over time. However, the rapid rise in agricultural prices could create inflationary pressures in many emerging economies, where food represents a higher proportion of consumer expenses. (Source: Fidelity)
UNEMPLOYMENT
On Wednesday, July 2, a report on the U.S. labor market was better than expected in that 281,000 private-sector jobs were created in June compared with an estimated increase of 210,000.
Although this is certainly good news, many investors say that stocks will need continued evidence of an improving economy to sustain the move higher. (Source: Wall Street Journal, July 3, 2014)
CONCLUSION
Equities have provided a nice return for the first half of 2014, so now what should an investor do? Your answer could depend upon your “worry level.” Some believe that stocks will benefit from robust earnings and low interest rates, while many other financial professionals are spending sleepless nights focusing on downward equity outlooks. The Federal Reserve has been a key factor in why equity markets have done well since 2009, but they have already started paring back their bond purchase programs and they will need to raise interest rates eventually.
Several money managers are suggesting that the five-year-plus bull market may be getting long in the tooth, but few are selling the bulk of their portfolios and leaving the room. Those money managers who sided with caution so far in 2014 have underperformed the indexes; however, even the great Confucius once said “the cautious seldom err.” Money managers that sometimes hold large cash positions don’t always move in sync with peers or benchmark indexes. Approaching market tops, they may become increasingly cautious, while peers remain fully invested. Thus, it is common for such money managers to trail peers when stocks are moving higher like they did in the first half of this year.
Several money managers are referring to the current period as the “new neutral.” Although U.S. stock indexes are pushing through fresh records and valuations have passed pre-financial crisis levels, some analysts believe markets aren’t overvalued yet.
“Sure, the S&P 500’s valuations look high on historical standards, but it’s really about ultra-low yields,” Bill Gross, chief investment officer at Pimco, told CNBC recently, citing Pimco’s “new neutral” mantra that the neutral federal funds rate will be lower for longer. “Based upon our assumption that this new neutral stays low, they’re not as bubbly as some would suggest,” Gross said.
“If fed funds going forward stops at 2% instead of 4%, which is historical, then [the Dow Jones Industrial Average, or DJIA] at 17,000 and high yield spreads at 350 basis points over Treasurys are attractive and are less bubbly than some would imagine,” he said.
In a blog post on July 2, Gross said that the “new neutral” means “all financial assets might logically be repriced relative to historical experience.”
Gross also noted that while the S&P 500’s 10-year cyclically adjusted P/E ratio, or cost adjusted P/E (CAPE), typically has predictive value of whether shares are overvalued, the “new neutral” indicates the CAPE’s historical median valuation of 17 times earnings may need to be adjusted to around 20-22 times. “That would mean the S&P 500’s current CAPE of 25 times isn’t terribly bubbly.”(Source: CNBC.com, July, 2014)
With the stock market setting new highs, investors face unusually tough choices. An examination of historical valuations points to proceeding with caution in the stock market. Normally during these times bonds would provide a safe harbor. Sadly, with interest rates still near historic lows, bonds might not provide the same portfolio protection as in years past and, potentially even worse, bond prices will decline when interest rates rise.
Fed Chairperson Janet Yellen warned investors on July 2 that, “Falling corporate bond spreads and volatility indicators are signs that investors may not fully appreciate the risk of future losses.” She continued her prepared remarks for a speech at the International Monetary Fund by also sharing, “that said, I do see pockets of increased risk-taking across the financial system.”
It’s not easy to structure a portfolio in the face of these risks, but investors still have to make some decisions. Perhaps the best advice is to continue to focus on your personal situation and timelines. Consider these three important questions:
- What is a realistic time horizon for my personal situation?
- What is a realistic return expectation for my portfolio?
- What is my risk tolerance?
Your answers to these questions will help us recommend what type of investment vehicles you should consider, which investments to avoid and how long to hold each of your investment categories before making major adjustments. For example, if you will need more cash flow from your investments over the next few years, you might consider different choices relative to someone who has a ten- to fifteen-year time horizon.
We are continually reviewing economic, tax and investment issues and drawing on that knowledge to offer direction and strategies to our clients.
We pride ourselves in offering:
- consistent and strong communication,
- a schedule of regular client meetings, and
- continuing education for every member of our team on the issues that affect our clients.
On a final note, remember, one of the major causes of a stock market decline may not be investment performance—sometimes it’s investor behavior.
A good financial advisor can help make your journey easier. Our goal is to understand our clients’ needs and then try to create a plan to address those needs. We continually monitor your portfolio. While we cannot control financial markets or interest rates, we keep a watchful eye on them. No one can predict the future with complete accuracy, so we keep the lines of communication open with our clients. Our primary objective is to take the “emotions” out of investing for our clients. We can discuss your specific situation at your next review meeting or you can call to schedule an appointment. As always, we appreciate the opportunity to assist you in addressing your financial matters.
P.S. During this year’s big Treasury rally, the question has been, “Who’s buying all those bonds?” The answer is the Federal Reserve. During the six months ended in May, the Fed bought 73% of all new Treasurys, notes Strategas Research Partners’ Daniel Clifton. That’s the largest percentage since the start of quantitative easing.
The reason isn’t greater demand, but reduced supply. With the budget deficit falling, the amount of bonds issued has declined faster than the Fed’s taper, or reduction in bond buying. That leaves a limited supply of bonds for others to buy, according to Clifton. Perhaps that’s why bonds have held up in the first half of 2014.
Note: The views stated in this letter are not necessarily the opinion of FSC Securities Corporation, and should not be construed, directly or indirectly, as an offer to buy or sell any securities mentioned herein. Investors should be aware that there are risks inherent in all investments, such as fluctuations in investment principal. With any investment vehicle, past performance is not a guarantee of future results. Material discussed herewith is meant for general illustration and/or informational purposes only, please note that individual situations can vary. Therefore, the information should be relied upon when coordinated with individual professional advice. This material contains forward looking statements and projections. There are no guarantees that these results will be achieved. There is no guarantee that a diversified portfolio will outperform a non-diversified portfolio in any given market environment.
Due to volatility within the markets mentioned, opinions are subject to change without notice. Information is based on sources believed to be reliable; however, their accuracy or completeness cannot be guaranteed.
In general, the bond market is volatile, bond prices rise when interest rates fall and vice versa. This effect is usually pronounced for longer-term securities. Any fixed income security sold or redeemed prior to maturity may be subject to a substantial gain or loss. The investor should note that investments in lower-rated debt securities (commonly referred to as junk bonds) involve additional risks because of the lower credit quality of the securities in the portfolio. The investor should be aware of the possible higher level of volatility, and increased risk of default.
The payment of dividends is not guaranteed. Companies may reduce or eliminate the payment of dividends at any given time.
Sources: CNN Money; Shiller PE Ratio; Barron’s, June 2014; Bob LeClair’s Finance, June 2014; Fidelity; Bob LeClair’s Finance, June 28, 2014; Wall Street Journal; CNBC.com 7/2014 Contents © 2014 Academy of Preferred Financial Advisors, Inc.
Economic Update – First Quarter 2014
 The first quarter of 2014 has proved to be very interesting with results that were significantly different than 2013. For example, the total return of the S&P 500 for the first quarter of 2014 was 1.8%. This is a far cry from the almost 10% rise in the same quarter of 2013. As of March 31, 2014, the Dow fell 0.7%—its first quarterly decline in a year. The NASDAQ ended the quarter up with a gain of 0.5%.
Contributing to the fall were concerns about many stocks’ rich valuations and lawmakers’ questions about high drug prices. During the quarter many stocks struggled to maintain the upward momentum of 2013, though they remained near record highs a majority of the past three months.
Fortunately for investors, stocks staged a broad rally on the last day of the quarter and kicked off the second quarter with major gains, propelling the S&P 500 to its seventh record close of the year. Although the Dow closed at the highest level of 2014, it was still 0.3% short of its December 31st record finish. (WSJ – April 2, 2014)
The Economy
The U.S. economy expanded at a 2.6% annual rate in the fourth quarter of 2013, up from 2.4% due to a revised calculation. Many economists expect economic growth to rebound in the second quarter as the weather improves. (WSJ – April 4, 2014)
One major problem in the first quarter was that U.S. exports fell in February due to weak demand overseas. This also caused the largest trade deficit since December of last year. (WSJ – April 4, 2014)
Another area of disappointment came from new-home sales, which dropped by 3.3% in February. Higher mortgage interest rates and poor weather conditions seemed to contribute to the decline.
But let’s look on the bright side. Most economic data has been positive recently and growth seems to be gaining traction, though at a pace less than we would like to see:
- Real GDP rose higher than its earlier estimate, chiefly due to consumer and business spending.
- The Conference Board’s Index of Consumer Sentiment climbed to 82.3 in March, its highest level in six years.
- Orders for durable goods also increased, along with personal income and spending.
The bottom line is that things are continuing to improve gradually. According to sources at Economy.com, “The economy’s fundamentals are strong. Businesses are profitable and competitive. Household debt loads are low and credit conditions are strengthening. Banks are well capitalized and liquid. The fiscal health of government at all levels is much improved.” (Bob Leclair’s Finance & Markets Newsletter- Mar. 29, 2014)
Possible Stock Market Correction
The U.S. equity markets provided strong gains in 2013. Despite worries about Fed tapering and higher interest rates, Washington’s dysfunctional behavior and a modest economic recovery, the S&P 500 rose almost 30% for the year. However, many investors started speculating about when the next correction would arrive and what could cause it.
The U.S. economy surged in the last quarter of 2013 and appears set to maintain that momentum. Even with this positive outlook, it shouldn’t surprise any investor if a market correction comes along and produces a decline of 10-12% and lasts up to eight weeks or longer.
One of the most obvious triggers for a correction could be a stalling U.S. economy. The economic data seem to show the economy continuing to recover at a modest pace, but there are still significant pockets of weakness and things could potentially change rapidly.
Another potential risk is high expectations for corporate earnings in 2014 and beyond. Many economists are skeptical that earnings growth can meet projections. If the market comes to the conclusion that the economy is not going to see that kind of earnings growth, this could be the catalyst that might cause a major correction. Also, an increase in the costs of raw materials, labor or interest expense could pose a threat to profit margins. If profit margins slip, current stock evaluations might prove unsustainable.
Outside factors are the most likely threats to the U.S. economy. Europe is a long way from resolving its problems or even being on a long-term path to recovery, and it could spin out of control at any time. China is changing its policies and those changes will affect the global economy. There are several significant emerging economies that could have debt payment or economic problems. A wide range of global political issues may also result in a crisis or war that could unsettle markets.
Of course, there may not be a correction at all. A major argument supporting that possibility is the fact that U.S. businesses are sitting on cash at a level not seen since WWII. According to Liz Ann Sonders, Chief Investment Strategist at Charles Schwab and Company, Inc., “We know the capital is there, but we haven’t had the animal spirits to put it back to work yet. But this is the year we’ll probably see increase in [capital expenditure] spending.” (Investment News–Feb. 2014)
Potential problems will always cause concern for the equity markets, but this does not necessarily mean you should constantly alter your portfolio. A prudent approach is to invest in a manner that will not cause you to be up all night worrying about your investments.
Interest Rate Changes
Long-term treasury interest rates moved a little lower at the end of the quarter. Many investors did not expect this when the Fed began to cut back on its bond-buying program. Although treasury rates have dropped, mortgage interest rates moved higher. This movement might have put a chill into new-home sales. Many investors are concerned that housing might not prove to be the investment that it has been in the past.
During this quarter, Federal Reserve Chairwoman Janet Yellen offered new assurances that the Fed plans to keep short-term interest rates near zero as long as unemployment stays relatively high and inflation low. This is what Ben Bernanke said throughout his term as Fed chief. On March 31st, in her first public remarks outside Washington since she took the Fed’s helm in February, Ms. Yellen said, “While there has been steady progress, there is also no doubt that the economy, and the job markets, are not back to normal health.” She also used unusually personal terms to describe why the economy needs these policies to support a weak job market, saying, “The Recovery still feels like a recession to many Americans, and it also looks that way in some economic statistics.” (WSJ, April 1, 2014)
The Fed announced on December 18th that it would start to reduce its bond‑buying program. It decreased its buying from $85 billion down to $75 billion in January of this year, $65 billion in February and March, and now $55 billion starting in April. What is left unsaid is how the tapering process will unfold from here. If left unchanged through the end of 2014, the Fed’s balance sheet will add $635 billion by December 31, 2014, taking the Fed’s total assets to $4.4 trillion. The Fed held only about $480 billion (i.e. $0.480 trillion) of securities in early September 2008. (Federal Reserve– March 19, 2014)
Bond Market Risks
 The bond market continues to confuse many investors. Since the Fed announced the tapering, there has been an expectation that interest rates would rise. However, bond prices are actually higher and interest rates are lower.
The long end of the treasury yield curve has flattened a bit, which suggests that many bond investors don’t see much in the way of U.S. economic growth. That is one of the reasons that many investors have put their money to work overseas. (Barrons – March 31, 2014)
Investors might still put their money into long-term bonds for safety. In fact on several occasions, bonds delivered strong returns. Currently, though, with market interest rates at such a low level, it’s difficult to even think that bonds will be able to offer most investors that kind of return at this time.
In the past, bond yields might have been high enough to compensate for their drop in value even if interest rates increased. But today, with interest rates remaining low, the math just doesn’t work. Conservative and moderate investors still need to consider bonds, but they should proceed with caution. We will be monitoring the bond market carefully over the next year or two. (Money Magazine – Jan. 2014)
Quantitative Easing
We are currently experiencing QE3, which started in September 2012 at $40 billion dollars of monthly bond purchases, increased to $85 billion/month in December 2012, and is now $55 billion/month. Five years ago, on President Obama’s inauguration day, the U.S. had a total debt of $10.6 trillion. By January 15, 2014, that number was up to $17.3 trillion. The increase of $6.7 trillion over this five‑year period equals an average daily deficit of $3.6 billion! (Treasury Department, January 20, 2014)
However, there is also some good news – reports in the first quarter of 2014 showed that December 2013 produced a surplus of $53 billion for the U.S. government. This was the first time that December has had “receipts in excess of outlays” since December 2007. (Treasury Department, January 2014)
What Should an Investor Do?
Be watchful. On March 9, 2014, the S&P 500® Index reached the fifth year of the bull market, which is quite an accomplishment. Since the global financial crisis hit bottom on March 9, 2009, the S&P has risen a cumulative 178%. This is quite an accomplishment: of the 13 bull markets since 1928, only four have made it to their fifth anniversary, and only two went on beyond a sixth. This worries some investors who fear the market might be nearing its peak. (Fidelity, March 2014)
 Put the current bull market into context. Today’s bull market has been strong, but it follows the third-worst bear market (a drop of 57% compared to the average of 37%). The current bull market also took much longer to return to its previous peak (4+ years vs. the 2-year average). While no one can predict the future, prior bull markets that survived beyond their five-year anniversaries went on to post much higher returns. (Fidelity, Mar. 2014, Bloomberg Finance, L.P.)
Minimize risk in the bond market. Bonds can still be a part of a diversified portfolio, but caution is probably a prudent strategy. Minimize your risk by:
- Reducing the maturity of bond holdings
- Using some bonds with floating rates
- Using shorter-duration bonds
- Incorporating some callable bonds, which can be redeemed before their stated maturity
Focus on your own personal objectives. Revisit your personal timeline. Understand your commitments and categorize your investments into near term, short term and longer term time horizons. We can easily help you with this.
Don’t try to predict the market. Ben Graham, father of value investing, has Warren Buffett as one of his most well-known disciples. Graham often said, “The individual investor should act consistently as an investor and not as a speculator.”You are an investor, not a fortune teller. Base your decisions on facts, not speculative forecasts.
Discuss any concerns with us. Our advice is not one-size-fits-all; we will always consider your feelings about risk and the markets as well as your unique financial situation when making recommendations. For example, given today’s stock and bond valuations, and the expectation of many economists that interest rates will rise, “there’s nothing wrong with pulling 10 % off the table and sitting in cash,” says James Stack, a market historian and editor of the Invest Tech Research Newsletter.
Our goal is to guide you based on your situation. If you have any questions, please call our offices.
Note: The views stated in this letter are not necessarily the opinion of FSC Securities Corporation, and should not be construed, directly or indirectly, as an offer to buy or sell any securities mentioned herein. Investors should be aware that there are risks inherent in all investments, such as fluctuations in investment principal. With any investment vehicle, past performance is not a guarantee of future results. Material discussed herewith is meant for general illustration and/or informational purposes only, please note that individual situations can vary. Therefore, the information should be relied upon when coordinated with individual professional advice. This material contains forward looking statements and projections. There are no guarantees that these results will be achieved. There is no guarantee that a diversified portfolio will outperform a non-diversified portfolio in any given market environment. Due to volatility within the markets mentioned, opinions are subject to change without notice. Information is based on sources believed to be reliable; however, their accuracy or completeness cannot be guaranteed. In general, the bond market is volatile, bond prices rise when interest rates fall and vice versa. This effect is usually pronounced for longer-term securities. Any fixed income security sold or redeemed prior to maturity may be subject to a substantial gain or loss. The investor should note that investments in lower-rated debt securities (commonly referred to as junk bonds) involve additional risks because of the lower credit quality of the securities in the portfolio. The investor should be aware of the possible higher level of volatility, and increased risk of default. The payment of dividends is not guaranteed. Companies may reduce or eliminate the payment of dividends at any given time. Sources: Wall Street Journal, Investment News, Bob Leclair’s Finance and Markets Newsletter, BTN Research, Federal Reserve -By the Numbers, Barron’s, Treasury Department, By the Numbers, Fidelity, March 2014, Bloomberg Finance, L.P. Copyright 2014 MDP Inc.
Economic Update – Fourth Quarter 2013
Wow – what a year! Federal Reserve chairman Ben Bernanke provided us with cheap credit for the 5th straight year, encouraging consumers to purchase big-ticket items, which kept the U.S. factories humming. These low interest rates pushed passbook savers and investors seeking conservative returns into the unpredictable securities market, which increased demand and in turn assisted in the increase of the markets. (Source: Barron’s, December 23, 2013)
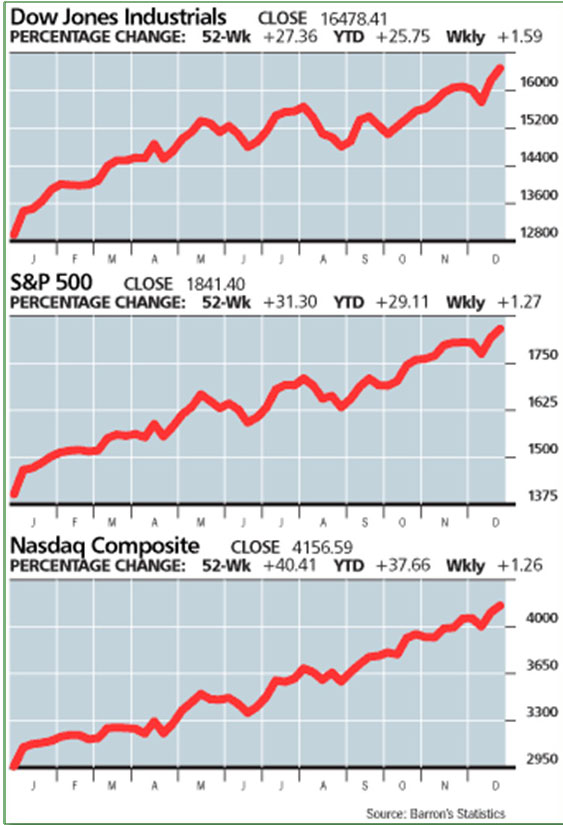 The Dow Jones Industrials climbed 27% during 2013, logging its best annual performance since 1995. In fact, the Dow Jones achieved a record high 52 times last year. The S&P 500 and the NASDAQ Composite also experienced significant gains last year, with total returns of 30% and 32%, respectively. (Source: WSJ, Jan. 2, 2014)
2013 was certainly a year to remember. Let’s review some notable highlights:
- January 1st – Democrats and the GOP announced the budget deal that averted the fiscal cliff
- March 15th – the Cyprus banking crisis marked a turning point for Europe, with a new tax on many bank depositors
- March 28th – the Dow Jones Industrials and the S&P 500 finally surpassed their October 2007 highs
- May 22nd – Ben Bernanke notified Congress the central bank might taper the size of its bond-buying program, which had kept interest rates low and lent support to the economy and the stock market
- September 18th – the Fed decided not to taper and the markets reacted favorably
- October 1st & October 16th – Congress failed to strike a budget deal, and nonessential government services shut down
- November 22nd – the S&P 500 topped 1800 for the first time, a day after the Dow hit a new high above 16,000. (Source: Barron’s, Dec.16, 2013)
When you consider all of the problems that the economy encountered last year, including the prospect of reduced federal stimulus and the Federal Government shutdown, you might ask how we arrived at these above-average returns. The contributing factors included:
- Continued earnings and profit growth, even though it was at a very slow pace.
- Investors were willing to pay more for earnings in recent years, especially in 2013.
- Investors’ worst fears were not realized—the U.S. did not default on its debt, China didn’t experience a hard economic landing, interest rates remained low, and Europe’s debt crisis abated.
- U.S. consumers felt more upbeat about the economy in December than during the prior two months, recovering from pessimism about the October government shutdown (according to the Conference Board’s index of consumer confidence).
- Consumers are stepping up their spending, which is vital since it represents 70% of the economy.
- Steady economic growth gave investors more confidence that companies rated investment grade (the equivalent of triple-B-minus or higher) wouldn’t have problems paying back bondholders.
- A booming U.S. energy sector and rising overseas demand brightened the economic picture in the last quarter, sharply increasing estimates for economic growth and hope for a stronger expansion.
- A scarcity of attractive investments outside of equities brought numerous investors to the stock market, and the increase in money and demand helped boost returns.
- Buybacks have increased per-share profits and signaled management’s confidence. In the biggest of these buybacks, the Federal Reserve spent more than $1 trillion last year to purchase U.S. Treasury and agency paper on the open market to foster economic growth.
- Companies are returning cash to shareholders via dividends. Payouts by the S&P 500 have increased by nearly 15% in the past year, nearly triple the historical average. (Source: The Complete Investor, December 30, 2013)
Looking Ahead to 2014
Tapering, which is the easing of the U.S. Federal Reserve’s $85 billion-a-month bond purchases, could affect the economy in 2014. Tapering is a vote of confidence in the improvement in the U.S. economy. To be successful, the Federal Reserve must get the timing of any move right, and must make clear the distinction between tapering and an actual rate hike.
The Fed has not always communicated its intentions well, and this tapering could become a major cause for a rocky stock market. In 2013, mere mention of tapering sent jitters through the markets, with stocks dropping as much as 6% last spring after Bernanke, on May 22, 2013, broached the idea of stimulus removal.
When the Fed announced in December to “taper” or scale back its stimulus starting in January 2014, many investors simply shrugged off the announcement. Investors now worry that the Fed could make missteps under its new boss, Janet Yellen, who will replace Chairman Ben Bernanke on February 1, 2014. Until the market has time to become comfortable with Yellen, there is greater potential for error or misinterpretation.
Another concern is an increased probability of a market correction. The current bull market began in March 2009 and the S&P 500 has rallied 162% since then. “Typically, bull markets that last more than four years eventually are knocked off course because of a recession,” states Thomas Lee, investment officer at JPMorgan Chase. Despite this, many economists predict stocks rising about 10% on the basis of corporate fundamentals. Lower gains might seem boring, but boring could be just what we need to renew investor confidence. (Source: Barron’s, Dec. 16, 2013)
Many strategists will be keeping an eye on Washington to see if Congress can reach an agreement in the spring on raising the Federal debt ceiling. A bipartisan budget deal was finalized in December and that offers some hope that politics won’t derail the bull market.
Bond Market
The bond market experienced a negative year with the return for the Barclays U.S. Aggregate Bond Index down 2%, its first decline since 1999. Many economists are concerned that one of the biggest risks for the bond market is that the economic upturn could end up accelerating even more, causing a continuing bearish environment for bonds. Bond yields remain low by historical standards and returns could suffer if interest rates rise, weighing on bond prices.
Highly rated companies sold a record $1.111 trillion of bonds in the U.S. in 2013, even as the debt offered the worst returns in five years. (Source: WSJ, January 2, 2014)
Yields on 10-year Treasury notes, the bond market’s main benchmark, jumped from 1.6% last May to just over 3% in December. For the year, the yield rose 1.27%, its largest annual climb since 2009 as investors positioned for the Fed’s tapering to begin. (Source: WSJ, January 2, 2014)
Even with an improving economy, given what they’ve experienced in recent years, many companies are likely to remain reluctant to increase capital spending or make acquisitions. Yet they have a mounting pile of cash at their disposal. The companies that comprise the S&P 500 (excluding the financials) held cash and marketable securities of $1.36 trillion at the end of the third quarter – an 18% increase from the same period a year ago. (Source: The Complete Investor, December 30, 2013)
International Countries
Many market indexes throughout the world had double-digit percentage gains as easy-money policies washed over concerns about growth. Japan’s Nikkei Stock Average surged 57% for its biggest gain since 1972. Germany’s DAX gained 25%, France’s CAC-40 rose 18% and Spain’s IBEX 35 climbed 21%. (Source: WSJ, January 2, 2014) European equities could add 15% in 2014, according to the Barron’s survey of 12 market strategists. Most analysts see the good times continuing for at least a couple years beyond 2014. (Source: Barron’s, Dec. 30, 2013)
Inflation
Inflation measures were well below the Fed’s 2% target. Core inflation, which excludes food and energy, has been around the 1.1% level, year after year. Many believe that the lingering threat of inflation could result in monetary policy being looser than expected, fueling continued rallies in stocks and keeping bond yields relatively low. (Source: Bob LeClair’s, Dec. 28, 2013)
Gold
Many economists had predicted 2013 would be lucky for gold. It appeared that all the pieces that inspired rallies in 2011 and 2012 were still in place, and gold had a seemingly unstoppable 12-year bull run behind it. Instead, gold fell and ended the year with a 28% loss. Investors, seeing little need for safety as stocks rose and inflation barely budged, sent gold to its first annual loss since 2000.
Unemployment
The government reported the U.S. economy has added jobs for 35 straight months, unemployment has fallen to a 4½ year low, and employers are laying off fewer workers. As Mark Twain said, “there are three types of lies: lies, damned lies, and statistics.” On August 2013, the official unemployment rate fell to 7.3%, the lowest level since December 2008. The harsh reality, however, is that more than 4 million Americans have been unemployed for more than 6 months. Since 1994, the government only counts people as unemployed if they are receiving jobless benefits. Once the benefits run out, they are no longer considered by the government to be unemployed.
Some people are going back to work for minimum wage. Some Baby Boomers have decided just to retire at a very young age. Some have decided to go back to school. Many more have simply been beaten down by constant rejection. On average, there are now three unemployed workers for every job opening. Some have gone on disability or other welfare, or are no longer productive.
Even Ben Bernanke says that long-term unemployment had become a “national crisis.” John Williams, editor of Shadow Government Statistics, calculates the actual unemployment rate at more than 23%. “The unemployment rates have not dropped from peak levels due to a surge of hiring; instead, they generally have dropped because of discouraged workers being eliminated from headline labor-force accounting.”
What do you do with this bad news? Simply be cautious. Even while the overall outlook remains positive, it is always best to be aware of potential problems and understand that various risks remain.
Conclusion
Yes, there are risks, but let’s review a few of the reasons as to why the bull market might continue: consumers are optimistic, manufacturing continues strong, construction spending improves and auto sales are up. In fact, many economists believe that the risks that lay ahead are more likely to be political and international rather than economic. Sure, we would like faster growth and even more jobs, but at least we are moving in the right direction. (Source: Bob LeClair’s, January 4, 2014)
This year could be very confusing for investors. We are constantly monitoring the economic environment and our goal is to keep you aware as things change. If you have any immediate concerns about your specific investments or portfolio prior to your next review, please contact our office.
Note: The views stated in this letter are not necessarily the opinion of FSC Securities Corporation, and should not be construed, directly or indirectly, as an offer to buy or sell any securities mentioned herein. Investors should be aware that there are risks inherent in all investments, such as fluctuations in investment principal. With any investment vehicle, past performance is not a guarantee of future results. Material discussed herewith is meant for general illustration and/or informational purposes only, please note that individual situations can vary. Therefore, the information should be relied upon when coordinated with individual professional advice. This material contains forward looking statements and projections. There are no guarantees that these results will be achieved. There is no guarantee that a diversified portfolio will outperform a non-diversified portfolio in any given market environment.
Due to volatility within the markets mentioned, opinions are subject to change without notice. Information is based on sources believed to be reliable; however, their accuracy or completeness cannot be guaranteed. Indexes cannot be invested in directly, are unmanaged and do not incur management fees, costs or expenses. No investment strategy, such as asset allocation and rebalancing, can guarantee a profit or protect against loss in periods of declining values. In general, the bond market is volatile, bond prices rise when interest rates fall and vice versa. This effect is usually pronounced for longer-term securities. Any fixed income security sold or redeemed prior to maturity may be subject to a substantial gain or loss. The investor should note that investments in lower-rated debt securities (commonly referred to as junk bonds) involve additional risks because of the lower credit quality of the securities in the portfolio. The investor should be aware of the possible higher level of volatility, and increased risk of default.
The payment of dividends is not guaranteed. Companies may reduce or eliminate the payment of dividends at any given time.
International investing involves special risks including greater economic and political instability, as well as currency fluctuation risks, which may be even greater in emerging markets.
The price of commodities is subject to substantial price fluctuations of short periods of time and may be affected by unpredictable international monetary and political policies. The market for commodities is widely unregulated and concentrated investing may lead to higher price volatility.
Sources: Wall Street Journal (1/2/14), Barron’s (12/16/13, 12/23/13), Bob LeClair’s Finance (12/28/13, 1/4/14), Bob Livingston Letter (November 2013), The Complete Investor (12/30/13), American Spectator (November 2013)
Contents Provided by MDP, Inc. Copyright 2014 MDP Inc.
Rules Eased for Health FSAs
 Recent changes announced by the Internal Revenue Service (IRS) modify the “use-it-or-lose-it” rule that applies to health flexible spending arrangements (FSAs). Plan sponsors will now have the option of allowing participants in health FSAs to carry over up to $500 of unused funds in a health FSA to the following plan year.
Background
Health FSAs are tax-advantaged employer-provided benefit plans that employees can use to pay for qualifying medical expenses. While generally funded through voluntary employee salary reductions, employers are able to contribute as well. Prior to the start of a plan year, employees decide how much to contribute to the health FSA (the maximum annual employee contribution to a health FSA that is part of a cafeteria plan is $2,500 for 2014). Contributions to the plan are excluded from income for federal income tax purposes, as are any reimbursements made from the plan for qualified medical expenses, including co-payments, deductibles, and dental and vision care expenses.
Any funds left unspent in the health FSA at the end of the plan year are forfeited–this is commonly referred to as the “use-it-or-lose-it” rule. Plan sponsors have the option of providing for a grace period of up to 2½ additional months after the end of the plan year (e.g., a calendar year plan might cover expenses incurred through March 15).
New rules
In Notice 2013-71, the IRS modified the “use-it-or-lose-it” rule that applies to health FSAs:
- Plans may now be amended to allow participants to carry over up to $500 of unused health FSA funds at the end of a plan year.
- Any carryover will not count against the $2,500 limit in the next plan year.
- A plan may allow participants a grace period, as described above, or the ability to carry over unused funds–but not both.
- A plan does not have to allow either the grace period or the carryover option.
- To adopt the carryover option, plans must be amended on or before the last day of the plan year from which amounts may be carried over, and may be retroactive to the first day of the plan year, provided certain requirements, including participant notification, are met.
- Special rules apply to plan years beginning in 2013–these plans may be amended to retroactively adopt the carryover provision at any time on or before the last day of the plan year that begins in 2014.
Word of caution
A health FSA plan can’t have both a grace period and a carryover option, so plans with existing grace periods will have to be amended to remove the grace period feature in order to add carryovers. Plan sponsors should consult carefully with a benefit specialist before taking any action, however, as eliminating an existing grace period feature raises potential issues relating to the Employee Retirement Income Security Act of 1974 (ERISA). IRS Notice 2013-71 itself states that “the ability to eliminate a grace period provision previously adopted for the plan year in which the amendment is adopted may be subject to non-Code legal constraints.”
Prepared by Broadridge Investor Communication Solutions, Inc. Copyright 2014.
2013 Year-End Tax Report
Year-End Tax Moves for 2013
One of our major goals is to help our clients identify opportunities that coordinate tax reduction with their investment portfolios. In order to achieve this goal, we stay current on ever-changing tax reduction strategies. This special report covers the details of many year-end tax strategies for 2013. Remember—every situation is different and not all strategies will be appropriate for you. Please discuss all tax strategies with your tax preparer prior to making any final decisions.
Income Tax Rates for

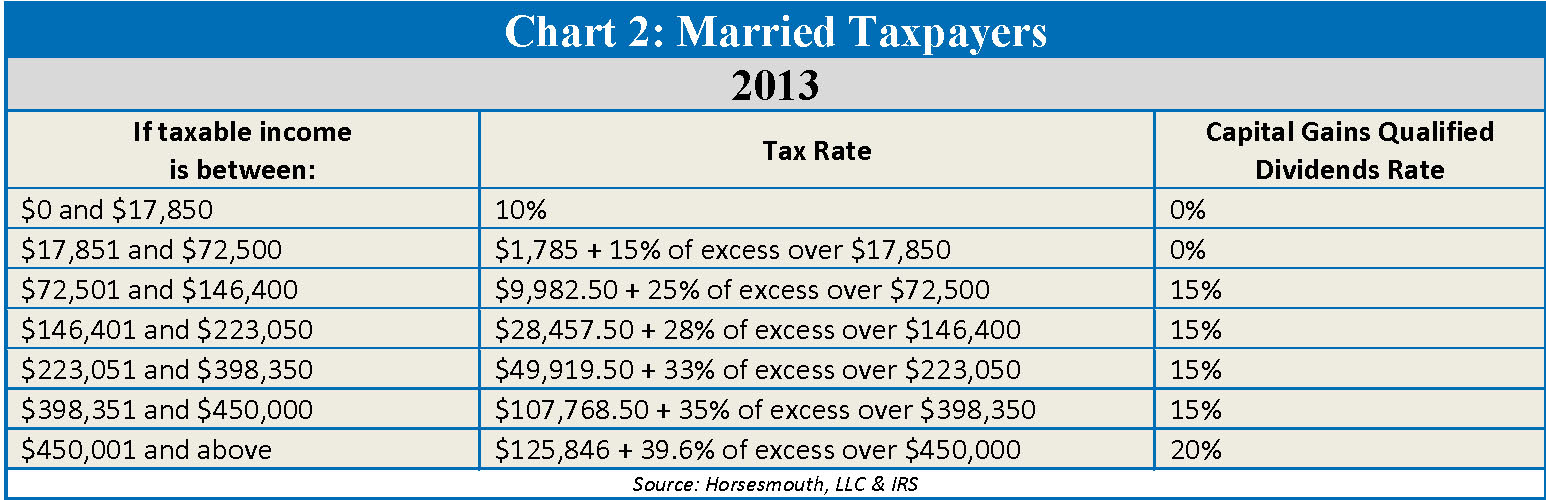
Income Tax Law Changes
Thanks to the American Taxpayer Relief Act of 2012 (ATRA), taxes rose sharply in 2013. The top marginal ordinary income tax rate for all taxpayers increased from 35% in 2012 to 39.6% in 2013. Additionally, the top marginal capital gains tax rate on long-term capital gains and qualified dividends increased from 15% in 2012 to 20% in 2013.
Medicare Tax
There are two major changes to the Medicare tax. The first is an additional 0.9% Medicare tax on wages and other earned income (such as self-employment income) exceeding certain thresholds. The other more expansive change is a 3.8% Medicare surtax on “net investment income” for wealthy taxpayers. The 3.8% Medicare surtax is on top of ordinary income and capital gains taxes, meaning long-term capital gains and qualified dividends may be subject to taxes as high as 23.8%, while short-term capital gains and other investment income (such as interest income) could be taxed as high as 43.4%!
The Medicare surtax is imposed only on “net investment income” and only to the extent that total “Modified Adjusted Gross Income” (“MAGI”) exceeds $200,000 for single individuals and $250,000 for taxpayers filing joint returns. The chart below shows which types of income are subject to this new Medicare tax.

For those of you who will be subject to this new Medicare surtax, some of the strategies that we can consider will take time to implement. Now is a good time to review your situation. For example, you might:
- Consider investing in tax-advantaged vehicles such as: tax-exempt bonds, qualified retirement accounts, qualified annuities, or cash value life insurance policies (assuming that the cost of acquisition and maintenance does not exceed the tax savings).
- Convert passive real estate activities to active interests.
- Marry someone who has large capital loss carry-forwards, or currently has large net operating losses (NOLs).
For specific ideas, please call our office or bring this up at your next review.
Capital Gains and Losses
Looking at your investment portfolio can reveal a number of different tax saving opportunities. Start by reviewing the various sales you have realized so far this year on stocks, bonds, and other investments. Then review what’s left and determine whether these investments have an unrealized gain or loss. (Unrealized means you still own the investment and haven’t yet sold it, versus realized, which means you’ve actually sold the investment.)
Know your basis. In order to determine if you have unrealized gains or losses, you must know the tax basis of your investments, which is usually the cost of the investment when you bought it. However, it gets trickier with investments that allow you to reinvest your dividends and/or capital gain distributions. We will help you calculate your cost basis.
Consider loss harvesting. If your capital gains are larger than your losses, you might want to do some “loss harvesting.” This means selling certain investments that will generate a loss. You can use an unlimited amount of capital losses to offset capital gains. However, you are limited to only $3,000 of net capital losses that can offset other income, such as wages, interest and dividends. Any remaining unused capital losses can be carried forward into future years indefinitely.
Be aware of the “wash sale” rule. If you sell an investment at a loss and then buy it right back, the IRS disallows the deduction. The “wash sale” rule says you have to wait at least 30 days before buying back the same security in order to be able to claim the original loss as a deduction. However, while you cannot immediately buy a substantially identical security to replace the one you sold, you can buy a similar security—perhaps a different stock in the same sector. This strategy allows you to maintain your general market position while utilizing a tax break.
Sell worthless investments. If you own an investment that you believe is worthless, ask your tax preparer if you can sell it to someone other than a related party for a minimal amount, say $1, to show that it is, in fact, worthless. The IRS often disallows a loss of 100% because they will usually argue that the investment has to have at least some value.
Always double check brokerage firm reports. If you sold a stock in 2013, the brokerage firm reports the basis on an IRS Form 1099-B in January 2014. Unfortunately, there were a number of problems implementing the new reporting rules last year, so we suggest you double-check these numbers to make sure that the basis is calculated correctly and does not result in a higher amount of tax than you need to pay.
Zero Percent Tax on Long-term Capital Gains
You may qualify for a 0% capital gains tax rate for some or all of your long-term capital gains realized in 2013. The strategy is to calculate how much long-term capital gain you would need to recognize to take advantage of this tax break. 
The 0% long-term capital gains tax rate has been permanently extended for taxpayers who end up in the 10% or 15% ordinary income tax brackets, which is up to $36,250 for single filers and $72,500 for joint filers. If your taxable income goes above this threshold, then any excess long-term capital gains will be taxed at a 15% capital gains tax rate and/or 20% capital gains tax rate, depending on how high your taxable income is for the year. (NOTE: The 0%, 15% and 20% long-term capital gains tax rates only apply to “capital assets” (such as marketable securities) held longer than one year. Anything held one year or less is considered “short-term capital gains” and is taxed at ordinary income tax rates.)
If you are eligible for the 0% capital gains tax rate, it might be appropriate to sell some appreciated stocks to take advantage of it. Sell just enough so your gain pushes your income to the top of the 15% tax bracket, then buy new shares in the same company. You do not have to comply with the “wash sale” and wait 30 days. With “gains harvesting,” you can actually sell the stock and buy it back in the same day. Of course, there will be transaction costs such as commissions and other brokerage fees. At the end of the day you will have the same number of shares, but with a higher cost basis. Please remember, you must also review your state income tax rules to determine whether or not these gains will be tax-free at the state level.
If you’re ineligible for the 0% capital gains tax rate, but you have adult children in the 0% bracket, consider gifting appreciated stock to them. Your adult children will pay a lot less in capital gains tax than if you sold the stock yourself and gifted the cash to them.
Taxation of Social Security Income
Social Security income may be taxable, depending on the amount and type of other income a taxpayer receives. If a taxpayer only receives Social Security income, this income is generally not taxable (and it is possible that the taxpayer might not even need to file a federal income tax return).
If a taxpayer receives other income in addition to Social Security income, and one-half the Social Security benefits plus the other income exceeds a “base amount,” then up to 85% of the Social Security income could be taxable. The “base amount” is $25,000 for single filers, $32,000 for married taxpayers filing a joint return. A complicated formula is necessary to determine the amount of Social Security income that is subject to income tax. (We suggest using the worksheet in IRS Publication 915 to make this determination.)
Finally, please note that Social Security income is included in the calculation of “Modified Adjusted Gross Income” (“MAGI”) for purposes of calculating the 3.8% Medicare surtax on “net investment income” (as discussed earlier). Therefore, taxpayers having significant net investment income will have more reason to defer Social Security benefits.
Kiddie Tax
When you make gifts to minors, pay close attention to the “kiddie tax.” This tax was tightened up a few years ago, so in more cases investment income earned by minors will be taxed at their parents’ highest marginal tax rate. Generally, the kiddie tax kicks in when a child’s investment income exceeds $2,000 for the year and the child was under age 19 (or under 24 if a full-time college student). It doesn’t matter if the parents claim the child as a dependent. (Details about the kiddie tax can be found in IRS Publication 17, IRS Publication 929 and in the instructions to IRS Form 8615, which are available for free at www.irs.gov.)
Itemized Deductions & Exemptions
Taxpayers are entitled to take either a standard deduction or itemize their deductions on IRS Form 1040, Schedule A. Itemized deductions include, but are not limited to, mortgage interest, certain types of taxes, charitable contributions and medical expenses. Unfortunately, itemized deductions are subject to several limitations. For example, starting in 2013 medical expenses are now deductible only to the extent that they exceed 10% of AGI in any given year. (The deductible was only 7.5% of AGI in 2012, which represents an increase of the deductible by 33% in only one year!) If you or your spouse are over 65, the deduction limit will stay at 7.5% until December 31, 2016.
Many taxpayers don’t have enough itemized deductions to reduce their taxes more than if they take the standard deduction. If you find you miss the threshold by only a small amount per year, it may be best to “bunch” your deductions every other year, taking a standard deduction in the alternate years. The standard deduction for 2013 is $6,100 for singles, $6,100 for married persons filing separate returns, and $12,200 for married couples filing jointly. However, for 2014, it is $6,200 for singles, $6,200 for married persons filing separate returns, and $12,400 for married couples filing jointly.
Confirm that you are taking all available dependent exemptions. It might be best to support your parents to make them dependents. Providing more than one-half of the support of a parent qualifies for the $3,950-per-dependent exemption and the ability to deduct medical, dental and educational expenses incurred for the parent or parents.
Miscellaneous Year-End Tax Reduction Strategies
Prepare a tax projection for 2013 and possibly 2014 to determine which tax bracket you are in. Then make use of the following strategies if they apply to your situation.
- If your itemized deductions/standard deduction and personal/dependency exemptions are greater than your gross income, you will have negative taxable income, with a $0 income tax liability. (This is often the case with seniors who receive tax-free Social Security income.) Thus, it may be prudent to increase your income from negative taxable income to zero taxable income (still zero tax!).
– One way to do this is to do a partial Roth IRA conversion (see later discussion).
– Another option would be to postpone some deductible expenses to 2014, which will increase your taxable income.
- If you are itemizing your deductions in 2013, you may want to consider accelerating some of these deductions before the end of this year (assuming that you have a taxable income this year). You can make your January 2014 mortgage payment in December 2013, maximize your payments of state or sales taxes (for example, by buying big ticket items in December), prepay state income taxes, or pay all your property taxes in 2013 rather than deferring them to 2014.
– Remember the credit card rule: a deductible expense is deducted in the year it is charged against your credit card regardless of the year in which you pay the credit card bill. So, you can still charge a deductible expense in 2013, deduct it on your 2013 tax return and not have to pay for it until 2014. Please remember that interest expense paid on personal debt, which most interest on credit cards is, is not deductible even if you itemize.
It is important to note that some itemized deductions (such as state income taxes, real estate taxes and miscellaneous itemized deductions) are not allowed when computing the “Alternative Minimum Tax” (“AMT”). If you are subject to the AMT, it is often best to delay payment on the disallowed deductions and push them off until 2014 or later tax years (when AMT is no longer an issue). It is always possible you might be able to use the deductions next year. We suggest that you talk with your tax preparer about AMT prior to using any deduction and exemption strategies we have mentioned.
Paying taxes is bad enough. Paying a penalty is even worse. If you face an estimated tax shortfall for 2013, have the extra tax withheld on an IRA distribution. Withheld taxes are treated as if you paid them evenly to the IRS throughout the year. This can make up for any previous underpayments, which could save you penalties.
If you turned age 70½ during 2013, you must take a “required minimum distribution” (“RMD”) from your traditional IRAs and/or qualified retirement plans (such as a 401(k) plan) on or before April 1, 2014. If you do not take out the entire amount of your first RMD by April 1, 2014, you will be faced with a 50% penalty on the amount that you failed to take out. Also, keep in mind that once you start taking RMDs, you will need to take them until you die. Failure to take out the entire RMD in any given year will result in a 50% penalty on the difference between the RMD and the amount you actually took out. (NOTE: If your first RMD is due by April 1, 2014, you will be responsible for taking out two RMDs in 2014. This will often put you in a higher tax bracket in 2014. Therefore, if you need to take out your first RMD by April 1, 2014, you may want to take your first RMD out on or before 12/31/2013.)
Charitable Giving
This is a great time of the year to clean out your garage and give your items to charity. However, please remember that you can only write off these donations to a charitable organization if you itemize your deductions. Sometimes the donations can be difficult to value. You can find estimated values for your donated clothing at http://turbotax.intuit.com/personal-taxes/itsdeductible/.
Send cash donations to your favorite charity by December 31, 2013, and be sure to hold on to your cancelled check or credit card receipt as proof of your donation. If you contribute $250 or more, you also need a written acknowledgement from the charity.
If you plan to make a significant gift to charity this year, consider gifting appreciated stocks or other investments that you have owned for more than one year. Doing so boosts the savings on your tax returns. Your charitable contribution deduction is the fair market value of the securities on the date of the gift, not the amount you paid for the asset, and therefore you avoid having to pay taxes on the profit!
Do not donate investments that have lost value. It is best to sell the asset with the loss first and then donate the proceeds, allowing you to take both the charitable contribution deduction and the capital loss.
Up through December 31, 2013, taxpayers age 70½ and older can transfer up to $100,000 directly from their IRA over to a charity, satisfying all or part of the required minimum distribution (RMD) with this IRA-to-charity maneuver.
Retirement Plans
In 2013, the maximum 401(k) and 403(b) contribution is $17,500 (plus a $5,500 catch-up contribution for those 50 or older by the end of the year). If you are self-employed, you have other retirement savings options. We can review these alternatives with you at your next appointment.
You can also contribute to a traditional IRA and/or Roth IRA for the 2013 tax year all the way up to April 15, 2014. The maximum traditional/Roth IRA contribution is $5,500 with a catch-up provision of $1,000. The traditional IRA deduction phases out depending on your MAGI and whether you or your spouse is covered by a workplace retirement plan. Depending upon your income level, you may be eligible to contribute to a Roth IRA. To determine your best decision, call our office or ask us at your next review.
Roth IRA Conversions
Some IRA owners are considering converting part or all of their traditional IRAs to a Roth IRA. This is never a simple and easy decision. Roth IRA conversions can be helpful, but they can also create immediate tax consequences and can bring additional rules and potential penalties. It is best to run the numbers and calculate the most appropriate strategy for your situation. Call us if you want to review your options.
Step-Up in Basis Rules
If someone gifts you an appreciated asset while he/she is alive, then your basis is the same as the basis of the donor (not the current fair market value). However, if you inherit certain appreciated assets, you receive a step-up in basis to the fair market value as of the date of the decedent’s death. This new cost basis is often much greater than the original basis that the decedent had in this investment. (Some investments, such as tax-deferred accounts like traditional IRAs, do not receive a step-up in basis.)
So, if you’re the one doing the gifting, how do you determine which asset is the best one to give?
- High-basis assets or cash are usually best, especially if you’re in poor health.
- Low-basis assets (properties with big gains) usually aren’t good gifts because gifted assets don’t usually receive a step-up in basis, so the recipient’s basis will be the same as your basis. The recipient will owe capital gains taxes on all the appreciation since you first bought the asset when they decide to sell. Holding such an asset in your estate until you die allows it to pass by way of inheritance, which grants the recipient a step-up in basis.
- Appreciated assets can be much better than cash if you are worried about the recipient spending the money instead of investing it. There are also other ways to reduce the chance that the recipient will sell the assets and spend the proceeds, such as giving through a trust, partnership or other vehicle.
- Appreciated assets can also be a good idea when the recipient is in the 0% capital gains tax bracket.
Estate and Gift Tax Opportunities
In 2013, each taxpayer can pass up to $5,250,000 (minus prior taxable gifts) to children and/or other beneficiaries without having to pay gift and/or estate taxes. Any transfers in excess of the $5,250,000 exemption amount are subject to a flat 40% tax rate. Each $1 of the gift tax exemption you use during lifetime reduces your estate tax exemption by $1. (NOTE: The $5,250,000 exemption amount is for federal gift and estate taxes only. Depending on which state you live in, there could be state gift, estate and/or inheritance taxes imposed.)
Many people believe that with the estate tax exemption set at over $5,000,000 per person, they don’t need to worry about shrewd, tax-wise ways to give wealth. However, these people might want to rethink their strategy. Congress can change the law (and has changed the law in the past), and your wealth could grow faster than expected, thereby subjecting you to estate tax. Nevertheless, before you gift something away, you need to consider the income tax effects of making a particular gift. Giving away the wrong asset can cost your family some unnecessary taxes.
Make use of the annual gift tax exclusion. You may gift up to $14,000 tax-free to each person in 2013. These “annual exclusion gifts” do not reduce your lifetime gift tax exemption. (NOTE: The annual exclusion gift is doubled to $28,000 per recipient for joint gifts made by married couples or when one spouse consents to a gift made by the other spouse.)
Help someone with medical or education expenses. There are opportunities to give unlimited tax-free gifts when you pay the provider of the services directly. The medical expenses must meet the definition of deductible medical expenses. Qualified education expenses are tuition, books, fees, and related expenses but not room and board. You can find the detail qualifications in IRS Publications 950; and the instructions for IRS Form 709 at www.irs.gov.
Don’t give loss property. When you give loss property, the recipient’s basis is the current fair market value. It may be better for you to sell the property and deduct the loss on your tax return, and then you can give the cash proceeds.
Review state gift tax rules. Make sure that any strategies you use also apply to your state. In fact, some taxpayers actually move to another state and establish residency in that state before selling or gifting any property.
Contribute to a 529 plan on behalf of a beneficiary. This qualifies for the annual gift-tax exclusion. Withdrawals (including earnings) used for qualified education expenses (tuition, books and computers) are income tax free. The tax law even allows you to give the equivalent of five years’ worth of contributions up front with no gift-tax consequences. Non-qualifying distribution earnings are taxable and subject to a 10% tax penalty.
Consider the beneficiary’s situation before making a sizable gift. Keep in mind that these gifts may actually backfire tax-wise in some cases. For example, a gift might make a student ineligible for college financial aid, or the earnings from the gift might trigger tax on a senior recipient’s Social Security benefits.
Make gifts to trusts. These gifts often qualify for the annual exclusion ($14,000 in 2013) if the gift is direct and immediate. A gift that meets all the requirements removes the property from your estate. The annual exclusion gift can be contributed for each beneficiary of a trust. We are happy to review the details with your estate planning attorney.
Consider discounted gifts. These are gifts in which the value of the property for tax purposes is less than the current value of the property, usually because there are some restrictions or defects that reduce the value to the beneficiary. Discounted gifts can be made to trusts or other vehicles. Discounted values are often 20% or more.
A gift that exceeds the annual exclusion gift either reduces your lifetime gift/estate tax exemption or it is subject to current gift tax. If you make a taxable gift, the IRS requires a gift tax return to be filed so it can track the reduction in your lifetime gift/estate tax exemption and also track any lifetime gift taxes you might pay. You should consider filing a gift tax return even when one isn’t required in order to hold the IRS to the three-year statute of limitations (there is no statute of limitations when no return is filed, so the IRS can come back years or decades later, argue that the property was undervalued, and impose a lot of penalties and interest on you or your estate). The gift tax return is IRS Form 709 which is available with instructions for free at www.irs.gov.
Conclusion
Are you having trouble keeping up with changes in the tax laws? In April 2011, IRS commissioner Shaulmen reported that there have been about 3,500 tax law changes since the year 2000. Remember, it was Albert Einstein that said, “The hardest thing in the world to understand is the income tax.” He said that way before it became a whopping 25-volume edition with over 70,320 pages.
Here are some numbers directly from the IRS; the average taxpayer who files an IRS Form 1040 needs about 23 hours to prepare the return. America spends more than 7.6 billion hours and over $193 billion each year just to figure out what taxes we owe—more than the hours used to build every car, van, truck and airplane manufactured in America.
One of our primary goals is to keep clients aware of tax law changes and updates. This report is not a substitute for using a tax professional. Please note that many states do not follow the same rules and computations as the federal income tax rules. Make sure you check with your tax preparer to see what tax rates and rules apply for your particular state.
There are many other additional tax reduction strategies that will vary depending on your financial picture. We encourage all of our clients and prospects to come in so that we can review your particular situation and hopefully take advantage of those tax rules that apply to you. We look forward to seeing you soon.
The views expressed are not necessarily the opinion of FSC Securities Corporation, and should not be construed, directly or indirectly, as an offer to buy or sell any securities mentioned herein. This article is for informational purposes only. This information is not intended to be a substitute for specific individualized tax, legal or investment planning advice as individual situations will vary. For specific advice about your situation, please consult with a financial professional. Contents Provided By MDP, Inc. Reviewed by Keebler & Associates. Copyright 2013 MDP, Inc.
Economic Update – Third Quarter 2013
Update! As of October 16, 2013, President Obama signed a bill to end the partial shutdown of the government and extend the debt ceiling until February 7, 2014. The information in this Quarterly Economic Update was based on the quarter ending September 30, 2013.
Review and Outlook
Wow! Talk about drama! Before we even get to the numbers, let’s look at the standoff between the Republicans and the White House that has resulted in the first government shutdown in 17 years. On October 1, 2013 congressional Republicans forced the shutdown with their demands to “defund” or delay the Affordable Care Act (ACA), otherwise known as “Obamacare”. At the time of this writing, Congress is still deadlocked.
Until some agreement can be reached, the shutdown has suspended all non-essential government functions. This means approximately 800,000 federal workers are at home with no pay. Another 1.3 million are still working but they will not be paid on time. The outcome is uncertain for a large number of government contractors. To give you a better idea of how this works, NASA is closed but the people supporting the astronauts currently on the International Space Station are still working. Lion-loving members of the public are currently shut out of the National Zoo, but zoo employees will continue to feed the lions!
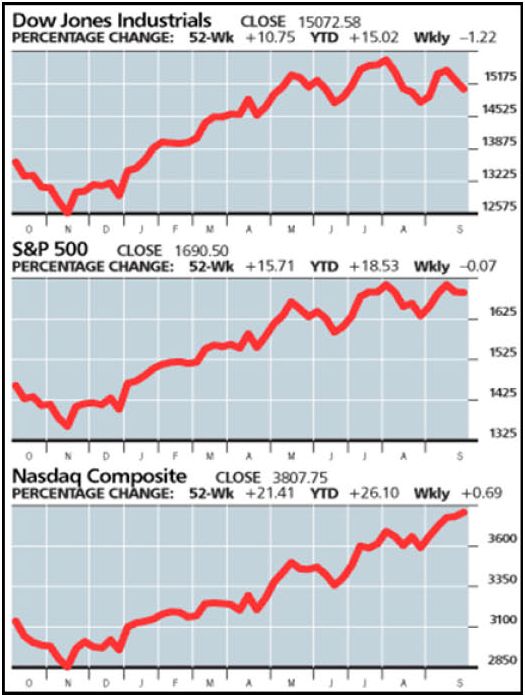 If history is any guide, the duration of the government shutdown matters, according to Richard Salsman, chief market strategist at InnerMarket Forecasting. Shorter government shutdowns are usually not disruptive, but longer ones are bearish, he says. There have been 17 previous shutdowns since 1976, ranging from 1 day to 26, with an average of 6 days. The S&P 500 has fallen by a mean 0.8% in past shutdowns, but for those lasting 10 days or more, a decline happened 80% of the time and averaged 2.6%. One month after the longer shutdowns ended, stocks were still down slightly, compared with the 1.7% average rise after the shorter shutdowns ended. Remember that past performance is no guarantee of future results. (Source: Barron’s, October 8, 2013, Stocks Track Washington’s Ups and Downs)
Investors are trying to gauge what is going to happen next as the government remains shut. During the first week of the fourth quarter, the broad stock market fell and rebounded daily, if not hourly, as a result of conflicting comments from senior political leaders. “It was a manic-depressive market,” says Paul Nolte, a portfolio manager with Dearborn Partners. (Source: Barron’s, October 8, 2013, Stocks Track Washington’s Ups and Downs) The shutdown “doesn’t seem to be phasing the markets all that much,” said Brian Jacobson, chief portfolio strategist for Wells Fargo Funds Management LLC, because “we’ve seen this coming from a mile away.” (Source: WSJ, October 5, 2013)
Many investors have likely become desensitized by a series of last-minute budget deals in recent years, most of which were followed by stock gains. Still, there is significant uncertainty over the extent to which the shutdown could affect economic growth and market volatility.
Even with all these concerns, major stock-market indexes continued their move into record territory in the third quarter. The S&P 500 gained 4.7% and headed into the fourth quarter up 18% for the year. The Dow Jones Industrial Average advanced 1.7% during the third quarter even as economic growth remained uneven. The Dow is up 14.9% for the first 9 months of 2013. The NASDAQ ended up 24.9% for the first 9 months and posted a 10.8% gain for the third quarter.
Debt Ceiling
As of October 17, 2013, the Treasury Secretary announced that the government will run out of cash and will be unable to pay its debts unless Congress first votes to raise the federal debt ceiling, which is the limit of how much money the federal government may legally borrow.
GOP leaders have stated they will agree to an increase of the debt ceiling only in exchange for a package of major budget changes, including; a delay of the health-care law, lower income tax rates, and adjustments to Medicare and Medicaid. While the White House has stated repeatedly it won’t negotiate any such agreement, many Republicans believe that this is their last chance to stop “Obamacare”, which includes big subsidies in entitlements. History suggests that such entitlements, once granted, are politically impossible to take away.
Rather than negotiate an end to the shutdown and a resolution to the debt ceiling issue, neither side has budged. The debt ceiling has been raised 74 times before. Raising it again should be routine—but what if no one backs down?
There have been warnings that a default by the U.S. government would be “catastrophic”—the government would soon begin falling behind on its bills, and this could potentially spark a financial crisis, including a stock market crash and a jump in interest rates.
America has never before found itself unable to meet its obligations. If the debt ceiling is breached, the government would have to rely solely on tax revenues, which currently cover only 84% of its expenditures. There is no question that the government would have to reduce some expenses, whether it is pensions or even interest on the National debt. However, since no politician wants to explain to grandma why her Social Security check stopped, odds are that none of this will happen—then again, looking at the mood in Congress, it’s hard to be optimistic. (Source: The Economist, October 5, 2013)
America’s government debt is considered a safe haven, which is why Uncle Sam can borrow so much so cheaply. America will not lose these advantages overnight, but an American default would cause unpredictable global repercussions. It is not just that America would have to pay more to borrow—it would threaten financial markets. Because American treasuries are very liquid and less risky, they are widely used as collateral. They make up more than 30% of the collateral that financial institutions such as investment banks use to borrow in the $2 trillion “tri-party repo” market, a source of overnight funding. A default could trigger demands by lenders for more or different collateral, which in turn could trigger a “financial heart attack” like the one caused by the Lehman Brothers collapse in 2008. (Source: The Economist, October 5, 2013)
World financial markets have already slipped on the frightening possibility that the U.S. could, in merely a few weeks, default on its debts in the absence of some agreement between the political parties. The Times of London called the “whole exercise irresponsible brinkmanship… when the world economy badly needs American leadership.” Far more worrying than these temporary effects, though, are the world’s broader doubts about American credibility and reliability. If our government can’t agree on a plan to keep the WashingtonMonument open, how can foreign powers count on the U.S. government to unite various efforts to accomplish much harder tasks internationally? Let’s face it: a superpower that can’t fund its government or pay its bills is not in a position to police problems worldwide.
The Congressional deadlock comes as our economy tries to gain traction more than four years after end of the Great Recession. Many consumers are slowly improving their personal finances. Some businesses are boosting hiring at a modest pace. The housing market is regaining lost ground and many stock indexes aren’t far off from their record highs. Many investors are more concerned with near-term decisions about the Federal Reserve’s bond-buying program than about news from Capitol Hill. In fact, confidence among U.S. consumers fell to a 5-month low this month according to a study by the University of Michigan released on Friday, September 27, 2013.
Sure, what’s happening in Washington is scary. With the government closed, the debt ceiling approaching, and an end to the standoff nowhere in sight, it’s hard to ignore the sense that a major collision is about to occur. However, as long as the default doesn’t occur, most problems will probably be short-lived.
In the meantime, the U.S. economy continues to move ahead, but at an extremely slow pace. After a recession there is supposed to be a recovery, but instead America has experienced its worst four consecutive growth years since the Bureau of Economic Analysis started compiling data in the 1930s. Recovery from the 2007-2009 Great Recession remains the slowest since World War II. Over the last three years we’ve averaged less than 2% annual growth, and in the first two quarters of 2013, the U.S. economy rose just 1.1% and 2.5%, respectively. The current GDP growth is estimated to continue at this mediocre 2.5% rate, with perhaps a slight increase in growth by mid-2014. (Source: Kiplinger’s Economic Outlook, October 2013)
Quantitative Easing
Quantitative Easing (QE) is the policy that Federal Reserve Chairman Ben Bernanke is using to promote economic recovery. Quantitative Easing has been implemented by the Fed’s $85 billion monthly bond buying (paid for with money the Fed creates out of thin air), which has kept interest rates artificially low and allowed the stock market to rally over the last 2 years. That’s an annualized rate of more than a trillion dollars. This is a breathtaking sum when you consider that the Great Recession, with its financial crisis, ended well over 4 years ago.
In May, Mr. Bernanke said that the Fed might change policies in the coming months by paring back or “tapering” its monthly bond purchases. Interest rates rose in response to his comment, which in turn caused the stock and bond markets to decrease significantly. Bernanke responded by stating that the economy is still weak, so federal policies will still be needed for a while and no changes will take place for the time being. This helped cap rising interest rates and helped halt the flight of capital from emerging markets.
Currently, the Fed does not have a fixed schedule for withdrawing QE or raising interest rates. It’s not likely the Fed will pull its support for the market before the current problems in Washington are resolved. (Source: Kiplinger’s Economic Outlook, October 10, 2013)
Inflation
Inflation is low by virtually every measure and has dropped below the Fed’s target of 2.0%. (Source: Bob Le’Clair’s Finance & Markets Letter, September 28, 2013) Although inflation appears to be tame at this time, this number does not include energy, food or healthcare costs.
Also keep in mind that although inflation hasn’t been much of a worry in recent years, even a modest amount will nibble away at your portfolio over time. Stocks don’t always beat inflation over short periods, especially when it’s caused by sudden spikes in oil or other commodity prices. But over the long haul, stocks are a powerful defense. Based on data going back to 1926, Morningstar’s Ibbotson unit reports that long-term bonds have historically returned only 2.6% annualized after inflation, compared to large-company stocks which have delivered close to 7%. (Source: Kiplinger’s Personal Finance, April 2013)
Unemployment
Thanks to the government shutdown, doors were closed doors at the Department of Labor, so the vital September employment report was not issued. However, the information we have through August shows that progress rebuilding labor markets is extremely slow and disappointing. (Source: Department of Labor)
The monthly job creation is averaging just 180,250, below the pace set in 2012 and well under the steady 200,000 a month that would signal a healthy economy. A total of about 2.1 million jobs will be created by year-end, which is little change from 2012. Prospects for next year don’t look much better, with an estimated net gain of about 2.25 million jobs over the course of the year and the unemployment rate of about 7.2% by year-end 2014. There are still about 2 million fewer jobs now than when the recession began in 2007. Including part-time workers looking for full-time work and people who have received the maximum unemployment benefit and dropped off, the records brings the unemployment numbers up to between 15-22%.
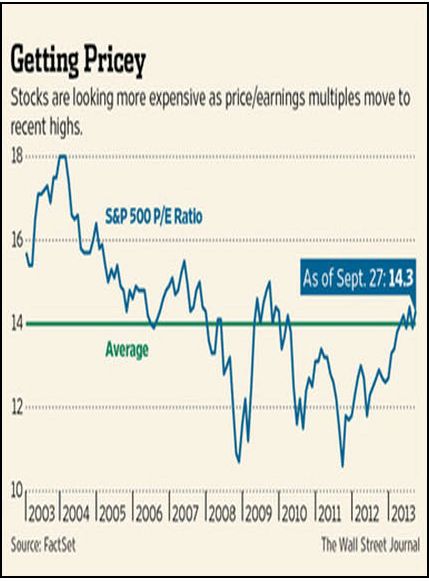 Price/Earnings Ratio
Stocks moved further into record territory in the third quarter before giving up some of their gains. The Fed’s pledge to keep current interest rates low indefinitely caused money to keep flowing out of low-yielding less risky investments such as government bonds and bank accounts and into alternatives such as the stock market. However, the bull market’s momentum has slowed lately, as rising valuations have prompted more investors to start selling some of their portfolio and rebalancing their current holdings.
Stocks have gotten pricier in recent months. The S&P 500 is trading at a price/earnings ratio of 14.3 times the next 12 months’ worth of earnings, which is above the average of 12.9 for the past 5 years and 14.0 for the past 10 years, according to FactSet. Many economists say the slow pace of corporate earnings growth has been inflated by stock buybacks, which has the effect of lifting earnings-per-share readings even when underlying sales growth remains soft. While some economists see stocks moving into dangerous territory, others predict we are still part of a bull market that still has legs.
According to many economists, with the uncertainty surrounding interest rates, bonds are now riskier than stocks. The values in stocks are currently better. As bond yields rise, bond prices fall. For example, consider that a 1-percentage point rise in interest rates will cause a 30-year Treasury bond to fall by 17%. For now, bond holders can expect to earn whatever they collect in interest, with little or no price appreciation—which means returns in the low single digits. That compares with a likelihood of high single digits (and possibly more) from stocks. For income investors, dividend-paying stocks are an enticing alternative to bonds—the 2.2% average yield on the S&P 500 stocks is about the same as the current yield on 10-year Treasuries. Many high quality companies are offering dividend yields well above the yields of their own bonds. In addition, although there are no guarantees, the appreciation potential on stocks is still greater over the long run if it is a good quality company.
Bonds are still a vital part of a diversified portfolio. During a period of rising interest rates, instead of avoiding bonds entirely, a more thoughtful strategy would be to adjust your exposure to bonds based upon their actual duration.
International Markets
Global trade and investment push more than $50 trillion annually to the world’s financial markets—a figure that more than triples the size of the U.S. economy. This figure exceeds even the annual trading volume in U.S. government securities, the largest and most active market in the world. The stalemate in Washington has caused global stock markets to slide, although many traders stress that conditions across financial markets remain calm. The third quarter was actually a good one for European stock markets, with the STOXX Europe gaining 8.9% compared to only 4.7% for the S&P 500. Despite investors’ general skepticism about Europe, Bob Baur, Chief global economist at Principal Global Investors, says he has been taking advantage of the market’s recent weakness to buy stocks that should perform well in the strengthening economy. (Source: Forbes, October 7, 2013)
Unfortunately, there was a major upset in the global markets that began with China’s decision to promote its exports by keeping the value of its currency, the Yuan, cheap to the dollar. When Chinese goods are cheap in global markets, foreigners buy them and create a huge demand for the Yuan. Despite the financial debt crisis in Europe and the turmoil in U.S. markets over the past few years, China’s economy has continued to register strong growth, with an annual growth rate of 10%. It is now the second largest economy in the world and China is the world’s largest exporter and second-largest importer. These transactions have averaged a staggering $800 billion per year during the last 10 years and increased China’s official U.S. dollar holdings at an annual rate of 31%. Beijing currently has amassed a reserve of more than $3 trillion. (Source: World Economic Database. International Monetary Fund website, reference 2011)
Other export-oriented emerging countries have also followed variations of this policy by keeping their currencies cheap against the dollar and amassing large reserves. Changes within these countries regarding their financial decisions are often the cause of the global economic upset, which we experience on a regular basis. The problem is that these excess savings have interfered with the normal flow of the boom-bust cycles, and therefore fostered above-average global volatility due to the size and independent nature of the liquidity flows.
Many economies, especially the emerging markets, are concerned about the U.S. Federal Reserve. If the Fed scales back stimulus efforts, it could be harder for these countries to obtain the dollars they need. However, if current trends continue, these emerging economies could rival the U.S., and China may soon overtake us. The International Monetary Fund (IMF) projects that in 3 years America’s share of world GDP could fall to 17.7%, less than China’s share. (Source: The Misrule of Law in America)
“Obamacare”
“Obamacare” is the most ambitious shake-up of America’s health care system since the 1960s. There are an estimated 55 million, or 1 in 7, people in the United States without health insurance. Starting January 1, 2014, these people will be required to buy insurance or pay a fine. Those who cannot afford it will receive subsidies; part of a big expansion of coverage to the sick and the poor.
The success or failure of this program in the coming months will be influenced by people signing up for health care exchanges, the types of plans they select, and their actual health experience. Democrats believe “Obamacare” can move the country toward universal coverage while keeping costs down. However, Republicans argue that you cannot extend health insurance coverage to 55 million additional people while simultaneously improving the quality of care and lowering costs. They view it as unaffordable, socialized medicine.
One of the biggest problems with America’s system is that insurers have long charged extremely high rates to the sick, or refused to cover them at all in many circumstances. Starting in January, this practice will be banned. Since insurers would soon go bankrupt if they sold only cheap plans to sick patients needing expensive treatment, “Obamacare” pushes the young and fit to buy insurance, too. This will give insurers revenue from cheap, healthy patients to offset the cost of insuring sick ones.
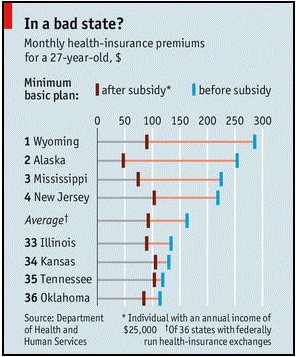 The cost of insurance will vary significantly and requires insurers to cover a minimum set of services. In most states, the simplest plans will become more comprehensive. Because there are many variables, “Obamacare” will have dramatically different effects from place to place and person to person. The law will raise health costs for some and lower them for others. For example, a 27 year old will pay $130 a month for a basic plan in Kansas, compared with $286 in Wyoming (see chart.) (Source: The Economist, October 5, 2013)
Overhauling America’s $2.7 trillion health sector is no easy task. America spends 18% of GDP on healthcare. The people of Britain, Norway, and Sweden, to name a few, spend half as much but actually live longer. Health spending is growing faster than wages, and is set to hit 20% of GDP by 2022, according to the Congressional Budget Office (CBO). The CBO states health costs remain the biggest long-term threat to America’s finances.
Public support is fragile—only 39% of Americans support “Obamacare”, while 51% disapprove, according to a recent poll by the New York Times and CBS. However, 56% would rather try to make the law work than stop it by stripping it of cash. Whether we eventually judge “Obamacare” a success or a catastrophe, only time will tell.
Conclusion
The 5 words going through every investor’s mind at this point: “What should I do now?”
The daily economic headlines are depressing and there is widespread fear that the combination of an aging population and pressures to embrace fiscal growth will weigh heavily on the economy. However, these fears tend to overshadow how much progress households are making in restoring their balance sheets. For example, balances on credit cards in the second quarter of 2012 were 22.4% below their peak in the fourth quarter of 2008, according to the Federal Reserve Bank of New York. That means Americans are saving again. The personal savings rate is now 4.2%, well above the low of 1% reached in April 2005.
Widespread fear of the consequences of the shutdown and the debt-ceiling debate may drive many investors to dump stocks and other risky assets, as they did during the last debt ceiling standoff in August 2011. You may want to buckle your seatbelt. However, now is not the time to completely overhaul your strategy, “It’s folly to try and Washington-proof your portfolio,” said Doug Cote, chief investment strategist at ING U.S. Investment Management. “This kind of thing can turn on a dime and the market can go up a lot faster than it goes down. So if you sell now, you’re just locking in losses.”(Source: Investment News, October 7, 2013)
As an investor, you can stay up all night worrying about what could happen, or you can simply focus on managing your portfolio for the long term. Make sure you have a well-diversified portfolio that can weather the corrective periods of the stock market cycle. Long term, stocks will usually reward investors for putting up with the short-term worries.
Remember the old rule of thumb, “Never waste a crisis!” Your investing behavior and choices can actually have a greater effect on your overall rate of return than the performance of your investments. History shows us that investors lose far more money as a result of their actions than markets lose for them.
P.S. Look in the mirror. History shows us that investors lose far more money as a result of their own actions than markets lose for them.
Note: The views stated in this letter are not necessarily the opinion of FSC Securities Corporation, and should not be construed, directly or indirectly, as an offer to buy or sell any securities mentioned herein. Investors should be aware that there are risks inherent in all investments, such as fluctuations in investment principal. With any investment vehicle, past performance is not a guarantee of future results. Material discussed herewith is meant for general illustration and/or informational purposes only, please note that individual situations can vary. Therefore, the information should be relied upon when coordinated with individual professional advice. This material contains forward looking statements and projections. There are no guarantees that these results will be achieved. There is no guarantee that a diversified portfolio will outperform a non-diversified portfolio in any given market environment.
Due to volatility within the markets mentioned, opinions are subject to change without notice. Information is based on sources believed to be reliable; however, their accuracy or completeness cannot be guaranteed.
Indexes cannot be invested in directly, are unmanaged and do not incur management fees, costs or expenses. No investment strategy, such as asset allocation and rebalancing, can guarantee a profit or protect against loss in periods of declining values.
In general, the bond market is volatile, bond prices rise when interest rates fall and vice versa. This effect is usually pronounced for longer-term securities. Any fixed income security sold or redeemed prior to maturity may be subject to a substantial gain or loss. The investor should note that investments in lower-rated debt securities (commonly referred to as junk bonds) involve additional risks because of the lower credit quality of the securities in the portfolio. The investor should be aware of the possible higher level of volatility, and increased risk of default.
The payment of dividends is not guaranteed. Companies may reduce or eliminate the payment of dividends at any given time.
International investing involves special risks including greater economic and political instability, as well as currency fluctuation risks, which may be even greater in emerging markets.
The price of commodities is subject to substantial price fluctuations of short periods of time and may be affected by unpredictable international monetary and political policies. The market for commodities is widely unregulated and concentrated investing may lead to higher price volatility.
Sources: Wall Street Journal (9/30/13, 10/5/13, 10/9/13), Barron’s (10/8/13), Kiplinger’s Economic Outlook (10/10/13), Bob LeClair’s Finance (9/28/13), The Economist (10/5/13), Investment News (10/7/13)
Contents Provided by MDP, Inc. Copyright 2013 MDP Inc.
