Economic Updates
Stay up-to-date on economic conditions and outlook with our analysis and commentary.
How will the election impact your portfolio?
By now, most voters have made up their mind about who they want to serve as their next President. But what can they look forward to, from an investment and tax standpoint, if their candidate wins or loses? How will the election affect their portfolio and future net worth?
Let’s look at the least predictable factor. An analysis of historical market returns under different administrations gives a frustratingly incomplete picture.
When a President comes into office and immediately enjoys a few boom years, is that due to his great policies or the policies of his predecessor? Similarly, when a President enters office in the middle of a recession (think Obama in 2009 and George W. Bush in 2001), can we attribute the weak market performance to any policies he hasn’t had a chance to enact?
The cliche that Republicans are better for markets than Democrats is hard to support based on the raw statistics. As you can see from the chart, Richard Nixon and George W. Bush are the only presidents who presided over a net loss in the markets, while Bill Clinton and Barack Obama are second and third behind Gerald Ford as the presidents associated with the highest total gains.
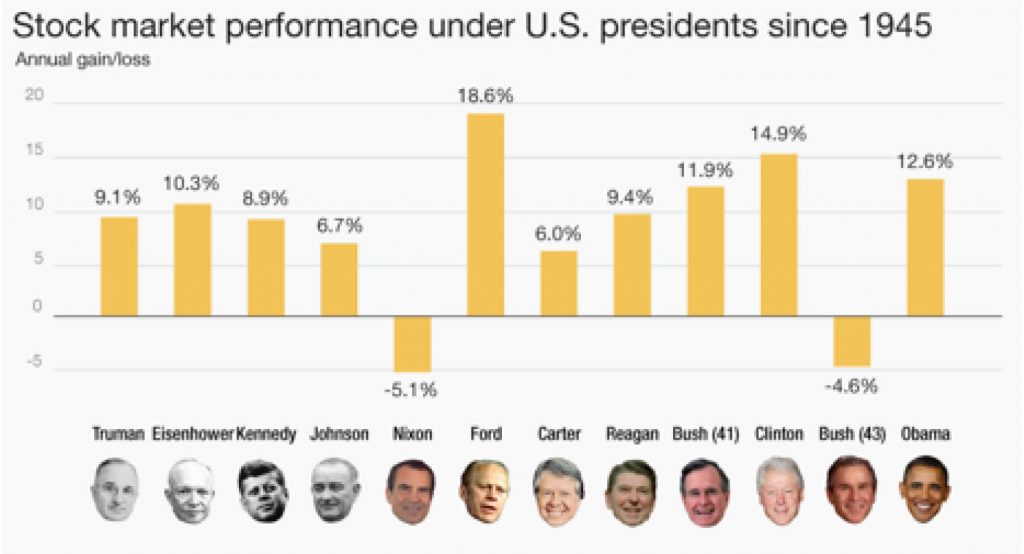
The record is too mixed, and too complicated, to make predictions based simply on the party that wins the white house.
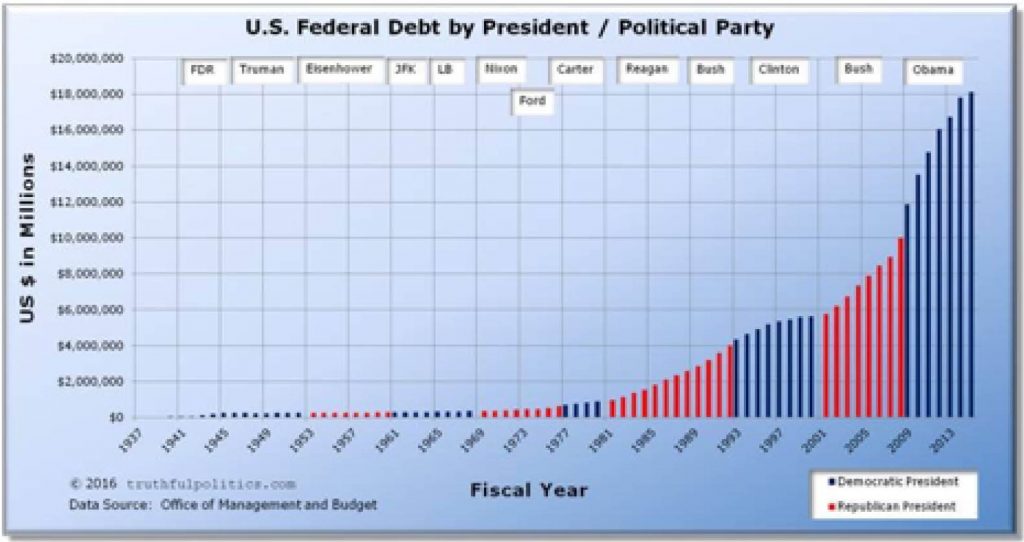
But what about something more concrete, like tax policy or budget deficits? Surely here we can read the tea leaves about the future.
Once again, the historical record can be misleading. President Reagan, known as a great tax cutter, lowered taxes with the 1981 tax act and promptly raised them again with new measures a year later. Democratic President Bill Clinton’s administration presided over the only budget surpluses of the modern era, while Republican President George Bush and Democratic President Barack Obama added more to the deficit than all previous presidents.
The most reliable clue we have about the fiscal and investment impact of a Donald Trump or Hillary Clinton presidency is the actual proposals by the candidates. But even here, we have to proceed with caution. It is unlikely that the Democrats will win the Presidency plus a majority in both the Senate and the House of Representatives, which means that a Clinton wish list will be either stymied or compromised by divided government.
Nevertheless, if Clinton is elected, we know to expect certain changes to the tax code. There will be at least an attempt to add a 4% surtax on incomes above $5 million, an end to the carried interest deduction favored by hedge fund managers and other Wall Street executives, plus a cap on itemized deductions when people reach the 28% tax rate.
In addition, the existing $5.45 million estate tax exemption would be reduced to $3.5 million ($7 million for couples), and estate amounts above that figure would be taxed at a 45% rate. Wall Street brokers would be hit with an unspecified surtax on high-frequency trading activities.
A President Trump would be more likely to get his wishes, but his exact wishes are far less certain. You can get a picture of the fuzziness of his policy proposals when you look at his promise of infrastructure spending.
When Clinton proposed spending $275 billion on road, airport and electrical grid repairs (surely not enough to move the needle on U.S. GDP growth), Trump immediately proposed spending $550 billion on the infrastructure—doubling his opponent’s figure without any apparent analysis.
Many of the proposals have been made off-the-cuff and some are contradictory, but you can expect a President Trump to make an effort to cut taxes by reducing the ordinary income tax brackets to 12% (up to $75,000 for joint filers), 25% ($75,000 to $225,000) and 33% (above $225,000).
Under Trump, the standard deduction would double, but itemized deductions would be capped at $100,000 for single filers ($200,000 for joint filers). Corporate tax rates would be reduced from a maximum of 35% to a maximum of 15%. Federal estate and gift taxes would be eliminated, but the step-up in basis would also be eliminated for estates over $10 million.
Lumping together Clinton and Trump’s various proposals (and making a variety of assumptions to cover the fact that the Trump plan is light on details), the Tax Foundation estimates that the Clinton proposals, in the unlikely event that they were fully-enacted, would reduce GDP by 1% a year and reduce the budget deficit by $498 billion. Candidate Trump’s proposals would reduce tax revenues by between $4.4 trillion and $5.9 trillion over the next decade, but the Tax Foundation believes they would add 6.9% to GDP.
Turning back to the markets, the investment herd prefers certainty and status quo to uncertainty and rapid change. A Clinton presidency checked by either the Republican House or a Republican House and Senate would provide a measure of stability.
A President Trump, with Republicans controlling both houses of Congress, would represent significant uncertainty, and off-the-cuff policy proposals introduced into the news media at random times would likely spook investors. Loose talk about “renegotiating” America’s debt with Treasury bond holders here and abroad (read: default, followed by demanding a haircut) could, all by itself, lower America’s bond rating once again, following the downgrade aftereffect of the government shutdown.

A Clinton presidency would almost certainly have a negative impact on the coal industry, and to the extent that there are new environmental regulations—which can be imposed by regulation without consulting Congress—it could also negatively impact the energy sector overall. It would not be surprising to see a carbon trading initiative, and more broadly a requirement that whatever environmental degradation companies impose on society will have to be paid for by the companies themselves in some form or fashion.
A Trump presidency would seem to favor industry in a variety of ways. The proposals are frustratingly unspecific, but we could expect less regulation (particularly environmental regulation), no raising of the minimum wage, lower corporate taxes across the board and protectionism.
On the other hand, if candidate Trump is serious about deporting undocumented immigrants, the U.S. labor supply would diminish in unpredictable ways. The policy would likely have the biggest negative impact on the farming and construction industries.
Perhaps the biggest risk in this election involves trade. A Trump Presidency would be seen, initially, at least, as a drag on the Mexican markets, and it might see America rip up its trade agreements and pick currency and trade wars with the emerging economic colossus that is China.
Interestingly, the Trans-Pacific Partnership agreement, which both candidates now reject, was an effort by the U.S. to create economic ties to Singapore, Korea, Vietnam and other countries in the Asian rim, the better to counter Chinese economic influence. In terms of global trade, China stands to win no matter who wins this election.
The bottom line: prepare for the possibility (but not the certainty due to gridlock) of higher taxes under a Hillary Clinton presidency, and a more certain (but hard to predict the details) lower-tax environment under a President Trump.
If you’re a Wall Street trader, you’re going to lose money under a Clinton presidency, and Southeast Asian nations stand to lose expected trade benefits under either president.
Despite the usual stereotypes, the deficit would likely go up under a Trump presidency and it might go down under a Clinton one — again with the caveat that comes with a divided government. The economic outlook would be much harder to predict.
The reality is that no matter who wins, America will still represent the most dynamic economy in the world, and whoever wins the White House is unlikely to change that.
Sources:
http://taxfoundation.org/article/details-and-analysis-hillary-clinton-s-tax-proposals
http://taxfoundation.org/article/details-and-analysis-donald-trump-tax-reform-plan-september-2016
2016 Third Quarter Economic Update
One hundred days after the Brexit scare – and three-quarters of a year after the most recent Fed rate hike – the markets once again confounded the instincts of nervous investors and went up instead of down. Last week, Fed Chairperson Janet Yellen told the world that the U.S. economy is healthy enough to weather a rise in interest rates, but the Fed governors met in September and declined to serve up the first rate hike since December 15. That was reassuring news to the Wall Street traders, and investors generally, helping to provide yet another quarter of positive gains in U.S. stocks.
The Wilshire 5000 Total Market Index – the broadest measure of U.S. equities – gained 4.53% for the third quarter, and is now up 8.39% for the first three quarters of the year. The comparable Russell 3000 index was up 4.40% for the quarter and is sitting on 8.18% gains so far this year.
 Larger companies posted the lowest gains. The Wilshire U.S. Large Cap index was up 3.92% in the third quarter of 2016, putting it at a positive 8.01% since the beginning of January. The Russell 1000 Large-Cap index provided a 4.03% return over the past quarter, with a gain of 7.92% so far this year, while the widely-quoted S&P 500 index of large company stocks posted a gain of 3.31% in the third quarter, and is up 6.08% for the year so far.
Meanwhile, the Wilshire U.S. Mid-Cap index was up 4.35% for the quarter, and is sitting on a positive gain of 11.31% for the year. The comparable Russell Midcap Index gained 4.52% for the quarter, and is up 10.26% for the year.
Small company stocks, as measured by the Wilshire U.S. Small-Cap index, gave investors a 7.67% return during the third quarter, up 13.03% so far this year. The comparable Russell 2000 Small-Cap Index gained 9.05%, posting an 11.46% gain so far this year, while the technology-heavy NASDAQ Composite Index gained 9.67% for the quarter and is up 6.06% heading into the final quarter of 2016.
Looking abroad, the U.S. remains a haven of stability in a messy global investment scene. The broad-based EAFE index of companies in developed foreign economies gained 5.80% in dollar terms in the third quarter of the year, but is still down 0.85% for the first three-quarters of the year. In aggregate, European stocks have lost 2.67% so far in 2016. Far Eastern stocks are up just 1.73% for the year. In contrast, a basket of emerging markets stocks domiciled less developed countries, as represented by the EAFE EM index, gained 8.32% for the quarter, and are sitting on gains of 13.77% for the year so far.
Looking over the other investment categories, real estate investments, as measured by the Wilshire U.S. REIT index, were down 1.21% for the second quarter, but still enjoy a gain of 9.75% for the year. Commodities, as measured by the S&P GSCI index, lost 4.15% of their value in the third quarter, but are sitting on gains of 5.30% for the year so far.
On the bond side, the interest rate story is essentially unchanged: rates are still low, once again confounding all the experts who have been expecting significant rate rises for more than half a decade. Ten-year U.S. government bonds are currently yielding 1.59%. Three-month notes were yielding 0.27% at the end of the quarter, while 12-month bonds were paying just 0.58%. Go out to 30 years, and you can get a 2.32% annual coupon yield.
What’s keeping stock prices high while sentiment appears to be “restrained”? Nobody knows the answer, but a deeper look at the U.S. economy suggests that the economic picture isn’t nearly as gloomy as it is sometimes reported in the press. Economic growth for the second quarter has been revised upwards from 1.1% to 1.4%, due to higher corporate spending in general and especially as a result of increasing corporate investments in research and development. America’s trade deficit shrank in August. Consumer spending – which makes up more than two-thirds of U.S. economic activity – rose a robust 4.3% for the quarter, perhaps partly due to higher take-home wages this year.
Meanwhile, if someone had told you five years ago that today’s unemployment rate would be 4.9%, you would have thought they were highly optimistic. But after the economy gained 151,000 more jobs in August, unemployment remained below 5% for the third consecutive month, continuing the downward trend. At the same time, average hourly earnings for American workers have risen 2.4% so far this year.
Based on their reading of the Treasury yield curve, economists at the Federal Reserve Bank of Cleveland have pegged the chances of a recession this time next year at a low 11.25%. They predict GDP growth of 1.5% for this election year—which, while below targets, is comfortably ahead of the negative numbers that would signal an economic downturn. (In general, a steep yield curve has been a predictor of strong economic growth, while an inverted one, where short-term rates are higher than longer-term yields, are associated with a looming recession.)
On top of everything else, corporate profits have been on a long-term upswing, even if the rise has been choppy since 2008. Will this long-term trend continue? Who knows?
The U.S. returns have been so good for so long that many investors are wondering why we are bothering with foreign stocks. A recent Forbes column suggested the answer. Since 1970, foreign stocks have outperformed international stocks almost exactly 50% of the time – meaning the long trend we’ve become accustomed to could reverse itself at any time.
Nobody would dispute that the economic statistics are weak tea leaves for trying to predict the market’s next move, and it is certainly possible that the U.S. and global economy are weaker than they appear. But the slow, steady growth we’ve experienced since 2008 is showing no visible signs of ending, and it’s hard to find the usual euphoria and reckless investing that normally accompanies a market top and subsequent collapse of share prices.
At the current pace, we might look back on 2016 as another pretty good year to be invested, which is really all we ask for.
Sources:
Wilshire index data. http://www.wilshire.com/Indexes/calculator/
Russell index data: http://indexcalculator.russell.com/
S&P index data: http://www.standardandpoors.com/indices/sp-500/en/us/?indexId=spusa-500-usduf–p-us-l–
NASDAQ index data: http://quicktake.morningstar.com/Index/IndexCharts.aspx?Symbol=COMP
International indices: http://www.mscibarra.com/products/indices/international_equity_indices/performance.html
Commodities index data:
http://us.spindices.com/index-family/commodities/sp-gsci
Treasury market rates:
http://www.bloomberg.com/markets/rates-bonds/government-bonds/us/
Aggregate corporate bond rates:
https://indices.barcap.com/show?url=Benchmark_Indices/Aggregate/Bond_Indices
http://www.bloomberg.com/markets/rates-bonds/corporate-bonds/
https://www.yahoo.com/news/yellen-defends-tougher-banking-regulations-141913276.html
http://www.bls.gov/news.release/pdf/empsit.pdf
https://www.yahoo.com/news/u-economy-less-sluggish-2nd-165152063.html
http://www.tradingeconomics.com/united-states/corporate-profits
https://www.clevelandfed.org/our-research/indicators-and-data/yield-curve-and-gdp-growth.aspx
Understanding Brexit – How will it impact me?

Yesterday’s vote by the British electorate to end its membership in the European Union seems to have taken just about everybody by surprise, but the aftermath could not have been more predictable. The uncertainty of how, exactly, Europe and Britain will manage a complex divorce over the coming decade sent global markets reeling.
London’s blue chip index, the Financial Times Stock Exchange 100, lost 4.4% of its value in one day, while Germany’s DAX market lost more than 7%. The British pound sterling is getting crushed (down 14% against the yen, 10% against the dollar).
Compared to the global markets, the reaction among traders on U.S. exchanges seems muted; down roughly 3% as you read this, though nobody knows if that’s the extent of the fall or just the beginning.
The important thing to understand is that the current market disruptions represent an emotional roller coaster, an immediate panic reaction to what is likely to be a very long-term, drawn out, ultimately graceful accommodation between the UK and Europe. German companies are certainly not 7% less valuable today than they were before the vote, and the pound sterling is certainly not suddenly a second-rate currency.
When the dust settles, people will see that this panicky Brexit aftermath was a buying opportunity, rather than a time to sell. People who sell may not realize that panic may be masquerading as an assessment of real damage to the companies they’ve invested in.
What happens next for Britain and its former partners on the continent? Let’s start with what will NOT happen. Unlike other European nations, Britain will not have to start printing a new currency. When the UK entered the EU, it chose to retain the British pound— that, of course, will continue. Stores and businesses will continue accepting euros.
 On the trade and regulatory side, the actual split is still years away. One of the things you might not be hearing in the breathless coverage in the press is that the British electorate’s vote is actually not legally binding. It will not be until and unless the British government formally notifies the European Union of its intention to leave under Article 50 of the Treaty of Lisbon—known as the “exit clause.”
If that happens, Article 50 sets forth a two-year period of negotiations between the exiting country and the remaining union. Since British Prime Minister David Cameron has officially resigned his post and called for a new election, that clock probably won’t start ticking until the British people decide on their next leader. For the foreseeable future, despite what you read, the UK is still part of the Eurozone.
After notification, attorneys in Whitehall and Brussels would begin negotiating, piece by piece, a new trade relationship, including tariffs, how open the UK borders will be for travel, and a variety of hot button immigration issues. Estimates vary, but nobody seems to think the process will take less than five years to complete, and current arrangements will stay in place until new ones are agreed upon.
An alternative that is being widely discussed is a temporary acceptance of an established model—similar to Norway’s. Norway is not an EU member, but it pays EU dues, and has full access to the single market as if it was a member. However, that would require the British to continue paying EU budget dues and accept free movement of workers—which were exactly the provisions that voters rejected in the referendum.
Meanwhile, since the Brexit vote is not legally binding, it’s possible that the new government might decide to delay invoking Article 50. Or Parliament could instruct the prime minister not to invoke Article 50 until the government has had a chance to study further the implications. There could even be a second referendum to undo the first.
The important thing for everybody to remember is that the quick-twitch traders and speculators on Wall Street are chasing sentiment, not underlying value, and the markets right now are being driven by emotion to what is perceived as an event, but is really a long process that will be managed by reasonable people who aren’t interested in damaging their nation’s economic fortunes.
Nobody knows exactly how the long-term prospects of Britain, the EU or American companies doing business across the Atlantic will be impacted by Brexit, but it would be unwise to assume the worst so quickly after the vote.
But you can bet that, long-term, everybody will find a way to move past this interesting, unexpected event without suffering—or imposing—too much damage. Meanwhile, the market roller coaster seems to have entered one of those wild rides that we all experience periodically.
Please reach out to your CAS advisor if you would like to discuss in further detail.
Sources:
https://www.yahoo.com/news/brexit-shows-global-desire-throw-142925862.html
https://www.washingtonpost.com/opinions/global-opinions/after-brexit-what-will-and-wont-happen/2016/06/24/c9f7a2f6-39f1-11e6-8f7c-d4c723a2becb_story.html
http://www.businessinsider.com/global-market-brexit-reaction-2016-6
www.ft.com/cms/s/0/f0c4f432-371d-11e6-9a05-82a9b15a8ee7.html#ixzz4CVixCz25
http://www.ft.com/cms/s/0/f0c4f432-371d-11e6-9a05-82a9b15a8ee7.html?ftcamp=traffic/partner/brexit/dianomi/row/auddev#axzz4CVide1Sz
http://www.newser.com/story/227149/brexit-now-what-happens-welcome-to-article-50.html
The Good Side of Bad Markets
 After the recent downturn in the U.S. and global stock markets, you can be pardoned if you wished that the markets were a bit tamer. Wouldn’t it be nice to get, say, a steady 4% return every year rather than all these ups and downs?
Be careful what you wish for. There are at least three reasons why you should hope the markets continue scaring investors half out of their wits.
- The very fact that stock downturns scare people is one reason why stocks deliver a higher return than bonds. Economists call it the “risk premium;” which can be roughly translated as: people are not willing to pay as much for an investment that will periodically frighten them to death as they would pay for an investment that delivers a less exciting investment ride. Over their history, stocks have been a fairly consistent bargain relative to less volatile alternatives, which is another way of saying that they’ve delivered higher long-term returns than bonds and cash.
- If you’re accumulating for retirement by putting money in the market every month or quarter, every downturn means that you can buy shares at a bargain price while many other investors are selling out at or near the bottom. Over time, as the market recovers, this can give a little extra kick to your overall return.
- Market downturns give an advantage to those who are willing to practice disciplined rebalancing among different asset classes. Basically, that means that when stocks go down, any new cash goes disproportionately into stocks to bring them back up to their former share of the overall portfolio. This, too, allows you to buy extra shares when the prices are low, and can also boost long-term returns.
There’s no question, the downward plunge on the stock market roller coaster is scary. It’s hard to maintain your discipline when the voice in the back of your brain is telling you to bail out on the bouncy trip before somebody gets hurt.
But unless this is the first time in history that the market goes down and stays down forever, we will ultimately look back on the decline and see a buying opportunity, rather than a great time to sell and jump to the sidelines. The patient, disciplined, long-term investor should see market volatility as one of your best friends and allies in your journey toward retirement prosperity.
Economic Update – Fourth Quarter 2015
Investor Update: Shortly after this economic report was written, equity markets experienced an unusually turbulent start to 2016. Experts feel that this recent market volatility is in reaction to a slowdown of growth and further currency devaluation in China combined with continued oil price weakness. As advisors, we are trained to make non-emotional decisions and the advice we offer clients is based on their personal situations. Our goal is to continue to carefully monitor the markets for our clients and keep a regular line of communication. If you need to talk with us prior to our next scheduled meeting, please call our offices.
 When the final day of trading closed on New Year’s Eve, the U.S. stock market finished a disappointing year for investors. Despite all the optimism that 2015 began with, there was limited, if any, joy by year end. The Dow Jones Industrial Average lost 2.2% for the year and the Standard and Poor’s 500 index was down 0.7%. This annual drop was the first since 2008. The NASDAQ was one of the only bright spots, gaining nearly 6% for 2015 despite the small-cap Russell 2000 index falling 5.7% and down 12.3% from its peak. (Source: Barron’s 1/4/2016, USA Today 12/31/2015)
Starting the year 2015, market strategists were looking for a 10% or higher rise in stocks. The final results of 2015 concluded a roller coaster year, to which many investors will likely say, “good riddance.” The U.S. dollar aside, most asset classes didn’t fare well.
Four factors that contributed to the weakness of stocks this year were: a further and unexpected decline in commodity prices, particularly oil; continued strength in the dollar; soft economic growth and a currency devaluation in China; and a Federal Reserve that only in December felt confident enough about the U.S. economy to begin raising interest rates. A year ago, many analysts expected that to happen as early as the first quarter of 2015.
“These cumulative head winds became too much….there was a deeply rooted fear that China’s growth might hit a wall,” says Thomas Lee, head of research at Fundstrat Global Advisors. “The market had a hard time standing up to all that.”
“Most people thought it would be a better year,” says Kate Warne, investment strategist at Edward Jones. After all, the S&P 500 index hit an all-time high of 2,131 in May. However, since August investors have been subject to heavy volatility.” (Source: Barron’s 12/19/2015)
Moving into 2016, caution still remains the top priority for most investors. Many analysts are still staying positive about the prospects for U.S. stocks in 2016, however, most reports conclude they are still bullish, but cautious. In their annual survey of prominent market strategists at big banks and investment firms, Barron’s found that this group expected moderate gains for the year ahead. (Source: Barron’s 12/14/2015)
Equities are not intended as an investment vehicle for investors with time horizons of one year, so any one-year projection can easily be wrong. The analysts Barron’s surveyed in 2015 were incorrect, so before we look at 2016, it might be helpful to review some key highlights from 2015.
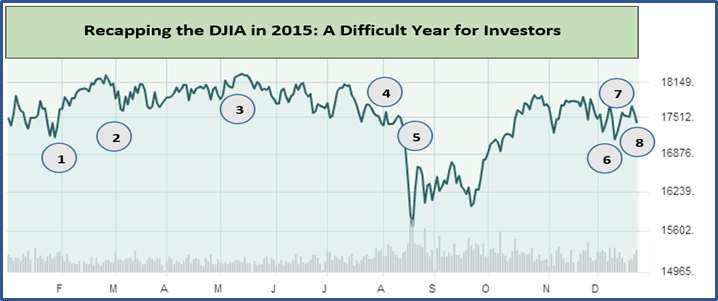 A Review of 2015
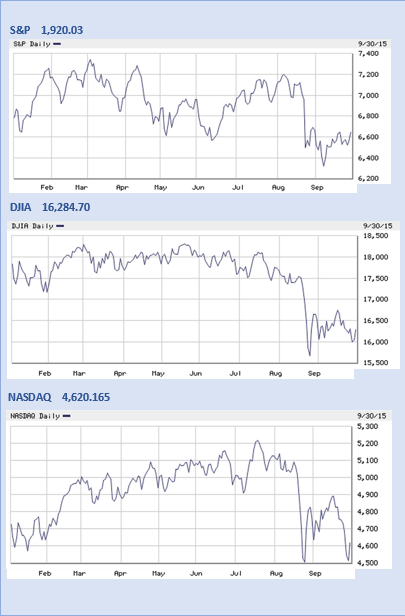
The year 2015 was a difficult one for investors. A brief review of some interesting events are spotlighted on the chart of the Dow Jones Industrial Average’s (DJIA) course during the year. As the recapping chart shows, the year began on a good note following a strong performance for investors in 2014. Interest rates were a major story all year and on February 2nd the 10-year Treasury yield made a low for the year at 1.67% (data point 1 on the chart).
Most investors enjoyed the bullish momentum during the 1st quarter and on March 13th, the U.S. dollar surged to a new high (data point 2 on the chart), which was later eclipsed (Source: Barron’s 12/14/2015)
In May, the Dow Jones Industrial average reached an all-time peak of 18,321 (data point 3 on the chart) and investors were still enjoying market gains. As the chart shows, the first half of 2015 was a mild one and many investors entered the summer in an encouraging mode.
China stunned the world’s financial markets on August 11th and 12th by devaluing its currency for two consecutive days, triggering fears its economy was in worse shape than investors believed (data point 4 on the chart). The Chinese authorities acted after a string of poor economic figures showed that previous efforts to boost exports and growth against the headwind of an overvalued currency had failed. As a result, the Yuan hit a 4-year low. A cheaper Yuan was sought to help Chinese exports by making them less expensive on overseas markets.
Many experts asked, why did the Chinese government do this? The most common answer was that despite the Chinese economy being the second largest in the world, after the U.S., it had been underperforming for the past year or so, according to Loren Brandt, a professor at the University of Toronto’s department of economics. So they clearly felt they had to do something to get exports moving again. “This is kind of a normal course of action that is seen in most weak economies,” Brandt says. “Their exchange rate adjusts and it provides a margin with which to try to help the economy recover.”
In 2014, China’s economic growth fell to 7.4%, a noted drop off from years of double-digit growth. China’s slowed economy made this type of action unsurprising to Brandt, who says it was a question of when, not if, the government would intervene. This measure was taken as a way to stimulate the Chinese economy which was still growing, but not at the pace that was previously anticipated. (Source: The Guardian 8/12/2015)
August 2015 was a challenging month for investors. For the first time in over 6 years, equity investors experienced a correction. On August 25th (data point 5 on the chart), U.S. stocks bottomed out for the year after a 12% correction. Fears of slowing global growth fueled the downturn and volatility had returned to the markets in a considerable way. (Source: Barron’s 12/14/2015)
Although the markets stayed volatile for the next three months, they clawed back some lost ground and on December 11th (data point 6 on the chart) WTI crude oil hit a six-year low of $35.62 a barrel. This meant a 33% price plunge for 2015. The drop in oil prices rewarded consumers at the pump, but punished energy stocks and investors as oil and energy related company share prices were hit hard.
For the entire year investors asked, “will they or won’t they” raise interest rates each time the Fed’s policy committee met. This was the most watched event throughout 2015 for investors. On December 16th, (data point 7 on the chart) Janet Yellen ended all of the debates that dominated investor discussions since December of 2008 when the central bank set its Federal funds target rate at 0% to 0.25% by raising that range by 25 basis points to 0.25% to 0.50%. This long awaited and much predicted rate increase was the first increase in interest rates and marked the end of an era of near 0% rates. (Source: Barron’s 12/21/2015)
Finally, by the year end (data point 8 on the chart), the Dow Jones Industrial Average finished the year down 2.2%, disappointing most analysts and investors.
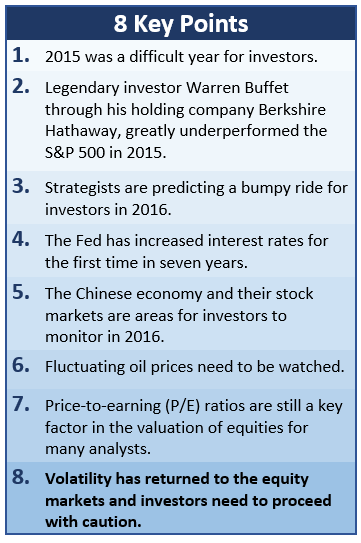
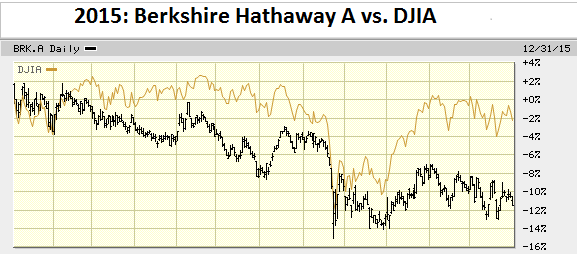 Warren Buffet perform in 2015?
Many investors suffered losses and had a rough year in 2015. Legendary investor Warren Buffet, through his holding company Berkshire Hathaway, has mightily underperformed the S&P 500 in 2015. His flagship BRK.A shares were down 11.47% compared with a 2.2% decrease in the DJIA. The media noticed as the Financial Times trumpeted “Buffett’s Worst Year Since 2009″ in a headline Wednesday, December 30th. (Source: Forbes 12/31/2015)
Indeed, 2015 was a rough year for conservative and value oriented investors like Mr. Buffet. As Investorplace.com reported, Berkshire Hathaway may have struggled in 2015, but that doesn’t mean the Oracle of Omaha has lost his touch. They reminded investors that although it shouldn’t need repeating, Warren Buffett is a long-term investor. They accurately report that the review of his one-year performance is more noise than signal because the data sample is far too short. They challenge investors to review his 5 year or longer term results. (Source: Investorplace.com)
His performance is so extraordinary it puts Warren Buffett in a super-elite pool, one that holds less than 1% of the population of investors, according to an analysis by Salil Mehta, a statistician and econometrician.
Still listed as one of the wealthiest men in the world, this was not Buffet’s first rough year; 2008 was also a bad year for Buffet and his holding company, Berkshire Hathaway. Buffett seeks out businesses that exhibit favorable long-term prospects. His timeframe is longer than one year, so like most good investors no one year dictates his success or lack thereof. Buffett says, “if you don’t feel comfortable owning a stock for 10 years, you shouldn’t own it for 10 minutes.” Buffet feels that the stock market will swing up and down, but in good times and bad, he stays focused on his goals. This is a great lesson for all investors. (Source: Investopia.com)
2016 Outlook
A big question on the mind of all investors: where is the currently erratic U.S. stock market headed in 2016?
Obviously no one will know till year end, but currently, not a single Wall Street stock strategist is calling for a complete bear market, or 20% drop. If they are right, the bull market will turn seven in March and stocks — which have tripled in value since March 2009 — will keep chugging higher. However, they say there’s a chance investors will see a replay of 2015 and the market could again trade sideways and deliver almost flat returns. That’s the takeaway from year-end 2016 S&P 500 price targets from 17 Wall Street strategists. The predictions range from a high of 2,360 — or 15.5% above the year-end close — to a low of 2,100, which equates to a gain of just 2.7%. Brian Belski, Chief Investment Strategist at BMO Capital Markets, feels that the U.S. stock market is in year seven of a 20-year secular, or long-term, bull run. What he is saying is that the S&P 500 will likely see a “cycle high” and suffer a “corrective phase” in 2016 that will leave the S&P 500 up just slightly at year end. “2016 could likely be bumpy,” Belski warned in his 2016 Outlook. As a reminder, the S&P 500 finished 2015 with a 0.7% loss for the year. (Source: USA Today 12/31/2015)
Here are some specific areas investors should watch in 2016:
Interest Rates
Now that the Fed has increased rates for the first time in seven years, almost every financial analyst and publication has a prediction for interest rate movements in 2016. For now, investors can expect more “will they or won’t they?” drama from the Federal Reserve.
The staff of Fortune magazine recently assembled its predictions for 2016. They forecast that the federal funds rate at the end of 2016 will be 0.5%, up from 0.25%. They expect the Federal Reserve to raise its interest rate targets once in 2016—but only once, as U.S. economic growth stays steady but slow, while inflation and wage growth also remain modest. Fortune sites that fears of seeming “political” during a presidential election year, sluggish growth in the Eurozone and a slowdown of the Chinese economic juggernaut will keep Janet Yellen and the rest of the Federal Open Markets Committee from pulling the trigger more often. They predict the Fed’s vacillation will be one of the year’s longest-running (and least loved) dramas. (Source: Fortune, 12/14/2015)
It is anyone’s guess when the Fed will raise interest rates and by how much. In December, Federal Reserve Chairperson Janet Yellen stated that “The committee expects economic conditions will evolve in a manner that will warrant only gradual increases in the federal-funds rate.”
As for rates paid on bank deposits, they are not getting off the floor just yet. Barron’s writes that “investors should not look for money market yields to rise enough to be discernable without a magnifying glass.” For 2016, interest rates are an issue that investors need to keep a watchful eye on. (Source: Barron’s 12/21/2015)
China
China is still one of the world’s largest and strongest economies. Both the Chinese economy and their stock markets are areas for investors to monitor in 2016. “In many countries the stock market can be seen as a leading indicator of the economy. But that is not true in China,” wrote Jeffrey Kleintop, Chief Global Investment Strategist at Charles Schwab. “You really can’t get any less related than the Chinese stock market and its economy.” Investors are encouraged to focus less on gyrations in China’s stock markets, and to pay more attention to the country’s economy. There, a gradual, expected slowdown is taking place.
Experts have known for a long time that China’s growth would slow as Beijing made reforms designed to shift the country away from building roads, railways and housing to generate growth to an economy powered by consumer spending. That’s happening now and economists expect a final growth of 6.8% in 2015, and around 6.5% this year. China is a far cry from the potent days when it posted GDP growth of 10% on a regular basis. But it should also be strong enough to maintain employment levels as difficult reforms are implemented. Slowdowns in China can have impacts on investors worldwide and investors need to pay attention. (Source: CNN Money 1/5/2016)
Oil
Oil prices were at highs of $100 per barrel in June 2014. Since then they have retreated to a new multi-year low of about $35 per barrel in December. While this rewarded consumers at the pump, there have been more than 200,000 oil related layoffs in 2015 and there are more projected for 2016. The energy industry has idled more than 1,000 rigs and slashed more than $100 billion in spending this year to cope with the bust, according to Bloomberg. More than 250,000 energy workers from around the world have lost their jobs since the start of the downturn. (Source: Houston Press 12/30/2015)
Energy and oil related stocks suffered big losses in 2015 and analysts are mixed on whether they will rise or continue to drop in 2016. The fluctuation of oil prices is another subject that investors need to monitor this year.
Corporate Earnings
Price-to-earnings (P/E) ratios are still a key factor in the valuation of equities for many analysts. According to Jurrien Timmer, Director of Global Macro at Fidelity Investments, the outlook for 2016 really seems to be more of an earnings question. The U.S. earnings cycle peaked in early 2015, profit margins are near record levels, and more than half of corporate earnings are coming from share buybacks. He feels that it remains to be seen what we can expect from earnings growth in 2016, especially if the sectors that are most tied to the global economy (industrials, energy, and materials) remain depressed. Mid-single-digit earnings growth might be a reasonable expectation. That’s where it was in 2013 and 2014, and where it would have been in 2015 if energy had been stripped out.
Fortunately, valuations seem reasonable, with the forward price-to-earnings ratio at 16 times earnings for the S&P 500 Index. Timmer believes valuations should remain reasonable even if yields do rise—provided such an increase is accompanied by an acceleration in earnings growth. Although valuations can be considered high by some measures, Timmer does not think they represent heavy danger. (Source: Fidelity 12/18/2015)
 Conclusion
Volatility should continue in the equity markets and investors need to proceed with caution. For many analysts there is a growing uncertainty about the sustainability of the path the global economy and markets have been on for the last seven years. At a minimum, this confluence of factors signals a considerable level of volatility in 2016.
Analysts are focused on the Fed, China, oil prices and stock valuations. So where does that leave us? Investors need to prepare for 2016 with a sense of caution. Individual investors still have to look at their own situations first. It is important to be cautious, but it is just as important to determine your own personal risk. That’s where we can help.
Now is a good time to ask yourself:
- Has my risk tolerance changed?
- What are my investment cash flow needs for the next few years?
- What is a realistic return expectation for my portfolio?
Your answers to these questions will govern how we recommend investment vehicles for you to consider. We can help you determine which investments to avoid and how long to hold each of your investment categories before making major adjustments. For example, if your cash flow needs have changed for the next few years, you might consider different investments than someone who has limited to no cash flow needs.
Investment needs are not one size fits all, so we continually review economic, tax and investment issues and draw on that knowledge to offer specific direction and strategies to our clients.
We pride ourselves in offering:
- consistent and strong communication,
- a schedule of regular client meetings, and
- continuing education for our team on the issues that affect our clients.
A good financial advisor can help make your journey more comfortable. Our goal is to understand our clients’ needs and then try to create a plan to address those needs. We continually monitor your portfolio. While we cannot control financial markets or interest rates, we keep a watchful eye on them. No one can predict the future with complete accuracy, so we keep the lines of communication open with our clients. Our primary objective is to take the emotions out of investing for our clients. We can discuss your specific situation at your next review meeting, or you can call to schedule an appointment. As always, we appreciate the opportunity to assist you in addressing your financial matters.

Note: The views stated in this letter are not necessarily the opinion of FSC Securities Corporation, Inc. and should not be construed, directly or indirectly, as an offer to buy or sell any securities mentioned herein. Investors should be aware that there are risks inherent in all investments, such as fluctuations in investment principal. With any investment vehicle, past performance is not a guarantee of future results. Material discussed herewith is meant for general illustration and/or informational purposes only, please note that individual situations can vary. Therefore, the information should be relied upon when coordinated with individual professional advice. This material contains forward looking statements and projections. There are no guarantees that these results will be achieved. There is no guarantee that a diversified portfolio will outperform a non-diversified portfolio in any given market environment. All indices referenced are unmanaged and cannot be invested into directly. Unmanaged index returns do not reflect fees, expenses, or sales charges. Index performance is not indicative of the performance of any investment. Past performance is no guarantee of future results. The Standard and Poors 500 index is a capitalization weighted index of 500 stocks designed to measure performance of the broad domestic economy through changes in the aggregate market value of 500 stocks representing all major indices. The Dow Jones Industrial average is comprised of 30 stocks that are major factors in their industries and widely held by individuals and institutional investors. The Shanghai Stock Exchange Composite Index is a capitalization-weighted index. The index tracks the daily price performance of all A-shares and B-shares listed on the Shanghai Stock Exchange. International investing involves special risks such as currency fluctuation and political instability and may not be suitable for all investors. Due to volatility within the markets mentioned, opinions are subject to change without notice. Information is based on sources believed to be reliable; however, their accuracy or completeness cannot be guaranteed. In general, the bond market is volatile, bond prices rise when interest rates fall and vice versa. This effect is usually pronounced for longer-term securities. Any fixed income security sold or redeemed prior to maturity may be subject to a substantial gain or loss.
Sources: Barron’s, Forbes.com, Investorplace.com, Investopedia.com, USA Today, Fortune, CNN Money, Houston Press, The Guardian, Fidelity
Contents provided by The Academy of Preferred Financial Advisors, Inc. ©
2015 Year-End Economic Update
 Year-End Tax Moves for 2015

One of our major goals is to help our clients identify opportunities that coordinate tax reduction with their investment portfolios. In order to achieve this goal, we stay current on ever-changing tax reduction strategies. This special report covers the details of many year-end tax strategies for 2015.
Remember—every situation is different and not all strategies will be appropriate for you. Please discuss all tax strategies with your tax preparer prior to making any final decisions.
Income Tax Rates for 2015
Tax brackets have changed slightly for 2015. For example, for the 2014 tax year, the top of the 15% federal income tax bracket for married couples filing jointly was $73,800. In 2015, that figure has been increased to $74,900. Below is a table of federal income tax rates for 2015.

Year End Tax Planning For 2015
As you read through this report you will find some key aspects of the current 2015 tax laws and how they may apply to your situation. Late-breaking decisions in Washington, D.C., always make it difficult to plan ahead. This year is no different, with dozens of provisions waiting to be renewed.
One tax break that remains as an open-ended question is a tax deduction for contributions to charitable organizations directly from an individual retirement account (IRA). Some retirees are holding off on taking their required minimum distributions until they know what happens with this law. Right now, some lawmakers say this and other tax breaks, like the deductibility of sales tax in some states that do not have income taxes, might be renewed. However, nothing is a sure thing until a final bill is passed.
Despite this uncertainty, there are many year-end tax moves around income and expenses you can make to lessen your tax liability based on what you do know. To the extent that income or expenses can be moved between 2015 and 2016, for many investors, year-end tax planning often is about determining the best decision in which year to earn additional income or to incur more tax deductions. Now is the time to focus on how to optimize your situation between these two years.
The goal of this report is to share strategies that could be effective if discussed and implemented before year-end. Choosing the appropriate strategies will depend on your income, as well as a number of other personal circumstances. As with all tax strategies it is always in your best interest to discuss your personal situation with your tax preparer before making any moves or final decisions.
While everyone’s situation is unique, we urge you to begin your final year-end planning now!
Consider All of Your Retirement Savings Options for 2015
If you have earned income or are working, retirement savers should consider contributing to retirement plans. This is an ideal time to make sure you maximize your intended use of retirement plans for 2015 and start thinking about your strategy for 2016. For many investors, retirement plans represent one of the smarter tax moves that you can make. Here are some retirement plan highlights:
- Higher 401(k) contribution limits. The elective deferral (contribution) limit for employees who participate in 401(k), 403(b), most 457 plans, and the federal government’s Thrift Savings Plan is $18,000. The catch-up contribution limit for employees aged 50 and over who participate in 401(k), 403(b), most 457 plans, and the federal government’s Thrift Savings Plan is an additional $6,000 ($24,000 total). As a reminder, these contributions must be made in 2015.
- IRA contribution limits unchanged.The limit on annual contributions to an Individual Retirement Arrangement (IRA) remains unchanged at $5,500. The additional catch-up contribution limit for individuals aged 50 and over is not subject to an annual cost-of-living adjustment and remains $1,000. IRA contributions can be made all the way up to the April 15, 2016 filling deadline.
- Higher IRA income limits.The deduction for taxpayers making contributions to a traditional IRA is phased out for singles and heads of household who are covered by a workplace retirement plan and have modified adjusted gross incomes (AGI) of $61,000 and $71,000 for 2015. For married couples filing jointly, in which the spouse who makes the IRA contribution is covered by a workplace retirement plan, the income phase-out range is 98,000 to $118,000 for 2015. For an IRA contributor who is not covered by a workplace retirement plan and is married to someone who is covered, the deduction is phased out in 2015 as the couple’s income reaches $183,000 and completely at $193,000 for 2015. For a married individual filing a separate return who is covered by a workplace retirement plan, the phase-out range is $0 to $10,000 for 2015. Please keep in mind, if your earned income is less than your eligible contribution amount, your maximum contribution amount equals your income.
- Increased Roth IRA income cutoffs.The AGI phase-out range for taxpayers making contributions to a Roth IRA is $183,000 to $193,000 for married couples filing jointly in 2015. For singles and heads of household, the income phase-out range is $116,000 to $131,000 in 2015. For a married individual filing a separate return, the phase-out range is $0 to $10,000 for 2015. Please keep in mind, if your earned income is less than your eligible contribution amount, your maximum contribution amount equals your income.
- Largersaver’s credit threshold. The AGI limit for the saver’s credit (also known as the retirement savings contribution credit) for low- and moderate-income workers is $61,000 for married couples filing jointly in 2015, $45,750 for heads of household, $30,500 for married individuals filing separately, and increasing to $30,500 for singles.
- Be careful of the IRA one rollover rule. IRA investors were always limited to one rollover per year, per IRA. Beginning on January 1, 2015, investors were limited to make only one rollover from all of their IRAs to another in any 12-month period. A second IRA-to-IRA rollover in a single year could result in income tax becoming due on the rollover, a 10 percent early withdrawal penalty, and a 6 percent per year excess contributions tax as long as that rollover remains in the IRA. Individuals can only make one IRA rollover during any one-year period, but there is no limit on trustee-to-trustee transfers. Multiple trustee-to-trustee transfers between IRAs and conversions from traditional IRAs to Roth IRAs are allowed in the same year. If you are rolling over an IRA or have any questions on this, please call us.
Roth IRA Conversions
Some IRA owners are considering converting part or all of their traditional IRAs to a Roth IRA. This is never a simple and easy decision. Roth IRA conversions can be helpful, but they can also create immediate tax consequences and can bring additional rules and potential penalties. It is best to run the numbers and calculate the most appropriate strategy for your situation. Call us if you would like to review your Roth IRA conversion options.
Capital Gains and Losses
Looking at your investment portfolio can reveal a number of different tax saving opportunities. Start by reviewing the various sales you have realized so far this year on stocks, bonds, and other investments. Then review what’s left and determine whether these investments have an unrealized gain or loss. (Unrealized means you still own the investment and haven’t yet sold it, versus realized, which means you’ve actually sold the investment.)
Know your basis. In order to determine if you have unrealized gains or losses, you must know the tax basis of your investments, which is usually the cost of the investment when you bought it. However, it gets trickier with investments that allow you to reinvest your dividends and/or capital gain distributions. We will be glad to help you calculate your cost basis.
Consider loss harvesting. If your capital gains are larger than your losses, you might want to do some “loss harvesting.” This means selling certain investments that will generate a loss. You can use an unlimited amount of capital losses to offset capital gains. However, you are limited to only $3,000 of net capital losses that can offset other income, such as wages, interest and dividends. Any remaining unused capital losses can be carried forward into future years indefinitely.
Be aware of the “wash sale” rule. If you sell an investment at a loss and then buy it right back, the IRS disallows the deduction. The “wash sale” rule says you have to wait at least 30 days before buying back the same security in order to be able to claim the original loss as a deduction. However, while you cannot immediately buy a substantially identical security to replace the one you sold, you can buy a similar security—perhaps a different stock in the same sector. This strategy allows you to maintain your general market position while utilizing a tax break.
Sell worthless investments. If you own an investment that you believe is worthless, ask your tax preparer if you can sell it to someone other than a related party for a minimal amount, say $1, to show that it is, in fact, worthless. The IRS often disallows a loss of 100% because they will usually argue that the investment has to have at least some value.
Always double check brokerage firm reports. If you sold a stock in 2015, the brokerage firm reports the basis on an IRS Form 1099-B in early 2016. Unfortunately, sometimes there could be problems when reporting your information, so we suggest you double-check these numbers to make sure that the basis is calculated correctly and does not result in a higher amount of tax than you need to pay.
Zero Percent Tax on Long-term Capital Gains
You may qualify for a 0% capital gains tax rate for some or all of your long-term capital gains realized in 2015. The strategy is to figure out how much long-term capital gain you might be able to recognize to take advantage of this tax break.
The 0% long-term capital gains tax rate is for taxpayers who end up in the 10% or 15% ordinary income tax brackets, which is up to $37,450 for single filers and $74,900 for joint filers (See chart on page 1). If your taxable income goes above this threshold, then any excess long-term capital gains will be taxed at a 15% capital gains tax rate and/or 20% capital gains tax rate, depending on how high your taxable income is for the year.
NOTE: The 0%, 15% and 20% long-term capital gains tax rates only apply to “capital assets” (such as marketable securities) held longer than one year. Anything held one year or less is considered “short-term capital gains” and is taxed at ordinary income tax rates.
If you are eligible for the 0% capital gains tax rate, it might be a good time to consider selling some appreciated investments to take advantage of it. Sell just enough so your gain pushes your income to the top of the 15% tax bracket, then buy new shares in the same company. The “wash sale” requirement to wait 30 days does not apply for gains. With “gains harvesting,” you can actually sell the stock and buy it back in the same day. Of course, there will be transaction costs such as commissions and other brokerage fees. At the end of the day you will have the same number of shares, but with a higher cost basis. Please remember, you must also review your state income tax rules to determine whether or not these gains will be tax-free at the state level.
If you’re ineligible for the 0% capital gains tax rate, but you have adult children in the 0% bracket, consider gifting appreciated stock to them. Your adult children will pay a lot less in capital gains tax than if you sold the stock yourself and gifted the cash to them.
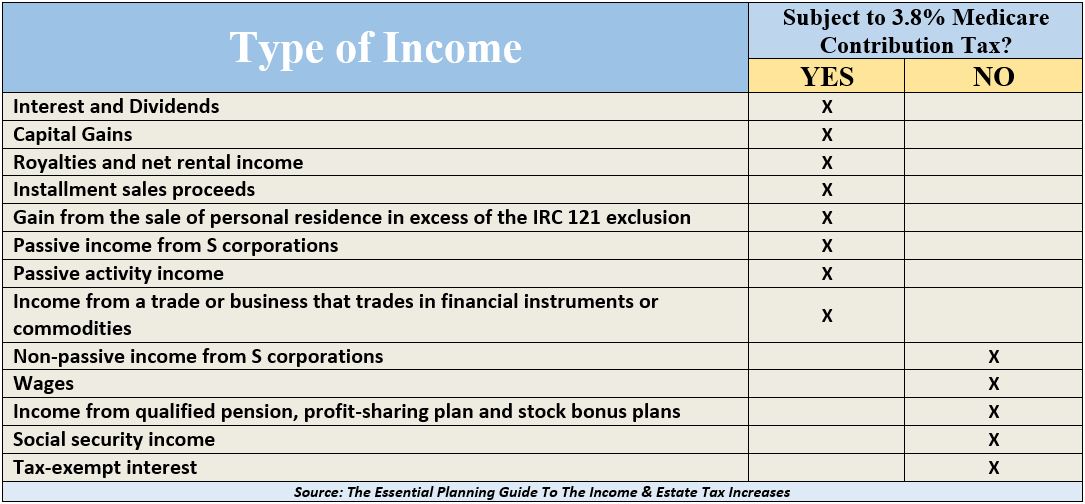
Medicare Tax
In 2015, a 3.8% Medicare surtax on “net investment income” remains in place for wealthy taxpayers. The 3.8% Medicare surtax is on top of ordinary income and capital gains taxes, meaning long-term capital gains and qualified dividends may be subject to taxes as high as 23.8%, while short-term capital gains and other investment income (such as interest income) could be taxed as high as 43.4%!
The Medicare surtax is imposed only on “net investment income” and only to the extent that total “Modified Adjusted Gross Income” (“MAGI”) exceeds $200,000 for single individuals and $250,000 for taxpayers filing joint returns. The chart attached shows which types of income are subject to this new Medicare tax.
For those of you who are subject to this new Medicare surtax, some of the strategies that we can consider will take time to implement. Now is a good time to review your situation. For example, you might:
- Consider investing in tax-advantaged vehicles such as: tax-exempt bonds, qualified retirement accounts, qualified annuities, or cash value life insurance policies (assuming that the cost of acquisition and maintenance does not exceed the tax savings).
- Convert passive real estate activities to active interests.
- Marry someone who has large capital loss carry-forwards, or currently has large net operating losses (just joking!).
Taxation of Social Security Income
Social Security income may be taxable, depending on the amount and type of other income a taxpayer receives. If a taxpayer only receives Social Security income, this income is generally not taxable (and it is possible that the taxpayer might not even need to file a federal income tax return).
If a taxpayer receives other income in addition to Social Security income, then up to 85% of the Social Security income could be taxable. There is a “floor” ($32,000 married filing jointly; $0 married filing separately; $25,000 all other taxpayers) whereby a portion of Social Security benefits become taxable and that the 85% inclusion kicks in once provisional income goes above a “ceiling” ($44,000 married filing jointly; $0 married filing separately; $34,000 all other taxpayers). For married taxpayers filing a joint return and for married persons filing separately who do not live apart from their spouses for the whole year, the “provisional income” threshold is $0. A complicated formula is necessary to determine the amount of Social Security income that is subject to income tax. (We suggest using the worksheet in IRS Publication 915 to make this determination.)
Finally, it is important to note that Social Security income is included in the calculation of “Modified Adjusted Gross Income” (“MAGI”) for purposes of calculating the 3.8% Medicare surtax on “net investment income” (as discussed earlier). Therefore, taxpayers having significant net investment income might have more reason to defer Social Security benefits.
Itemized Deductions & Exemptions
Taxpayers are entitled to take either a standard deduction or itemize their deductions on IRS Form 1040, Schedule A. Itemized deductions include, but are not limited to, mortgage interest, certain types of taxes, charitable contributions and medical expenses. Unfortunately, itemized deductions are subject to several limitations. For example, in 2015 medical expenses are deductible only to the extent that they exceed 10% of AGI this year. However, if you or your spouse are over 65, the deduction limit is still at 7.5% until December 31, 2016.
Consider “bunching” your deductions. Many taxpayers don’t have enough itemized deductions to reduce their taxes more than if they take the standard deduction. If you find you often miss the threshold by only a small amount per year, it may be best to “bunch” your deductions every other year, taking a standard deduction in the alternate years. The standard deduction for 2015 is $6,300 for singles, $6,300 for married persons filing separate returns, and $12,600 for married couples filing jointly.
Charitable Giving
This is a great time of the year to clean out your garage and give your items to charity. Please remember that you can only write off these donations to a charitable organization if you itemize your deductions. Sometimes your donations can be difficult to value. You can find estimated values for your donated clothing at http://turbotax.intuit.com/personal-taxes/itsdeductible/.
Send cash donations to your favorite charity by December 31, 2015, and be sure to hold on to your cancelled check or credit card receipt as proof of your donation. If you contribute $250 or more, you also need a written acknowledgement from the charity.
If you plan to make a significant gift to charity this year, consider gifting appreciated stocks or other investments that you have owned for more than one year. Doing so boosts the savings on your tax returns. Your charitable contribution deduction is the fair market value of the securities on the date of the gift, not the amount you paid for the asset, and therefore you avoid having to pay taxes on the profit!
Do not donate investments that have lost value. It is best to sell the asset with the loss first and then donate the proceeds, allowing you to take both the charitable contribution deduction and the capital loss. Also remember, if you give appreciated property to charity, the unrealized gain must be long-term capital gain in order for the entire fair market value (FMV) to be deductible. (The amount of the charitable deduction must be reduced by any unrealized ordinary income, depreciation recapture and/or short-term gain.)
The laws allowing taxpayers age 70½ and older to transfer up to $100,000 directly from their IRA over to a charity, satisfying all or part of the required minimum distribution (RMD), have not been renewed for 2015; in 2014 this was renewed very late in the year. We will keep you informed if this IRA-to-charity strategy is passed.
 Other Year-End Tax Strategies and Ideas

Make use of the annual gift tax exclusion. You may gift up to $14,000 tax-free to each person in 2015. These “annual exclusion gifts” do not reduce your lifetime gift tax exemption. (NOTE: The annual exclusion gift is doubled to $28,000 per recipient for joint gifts made by married couples or when one spouse consents to a gift made by the other spouse.)
Help someone with medical or education expenses. There are opportunities to give unlimited tax-free gifts when you pay the provider of the services directly. The medical expenses must meet the definition of deductible medical expenses. Qualified education expenses are tuition, books, fees, and related expenses but not room and board. You can find the detail qualifications in IRS Publications 950 and the instructions for IRS Form 709, which are available for free at www.irs.gov.
Contribute to a 529 plan on behalf of a beneficiary. This qualifies for the annual gift-tax exclusion. Withdrawals (including earnings) used for qualified education expenses (tuition, books and computers) are income tax free. The tax law even allows you to give the equivalent of five years’ worth of contributions up front with no gift-tax consequences. Non-qualifying distribution earnings are taxable and subject to a 10% tax penalty.
Make gifts to trusts. These gifts often qualify for the annual exclusion ($14,000 in 2015) if the gift is direct and immediate. A gift that meets all the requirements removes the property from your estate. The annual exclusion gift can be contributed for each beneficiary of a trust. We are happy to review the details with your estate planning attorney.
If possible, prepare a tax projection for 2015 and 2016 to determine if you will have a change in your tax situation. Then consider the following strategies if they apply to your situation.
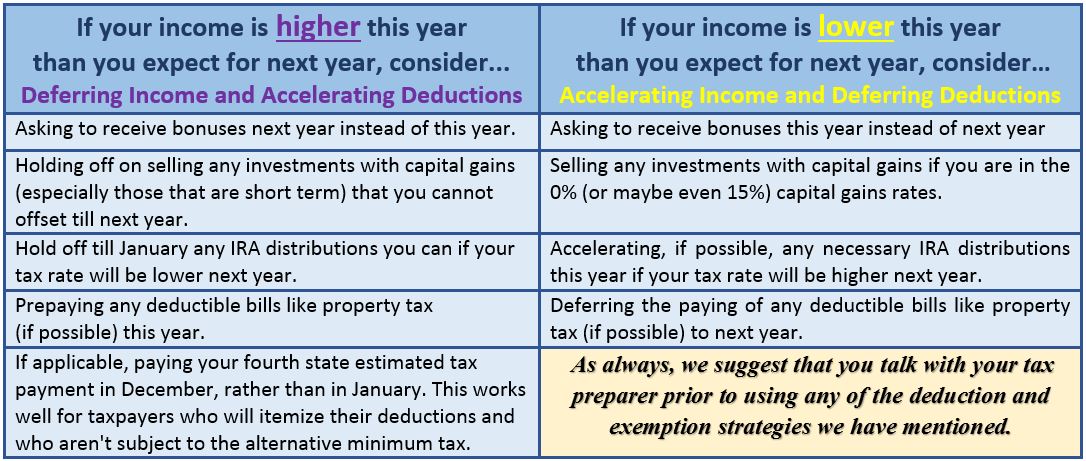
It is important to note that some itemized deductions (such as state income taxes, real estate taxes and miscellaneous itemized deductions) are not allowed when computing the “Alternative Minimum Tax” (“AMT”). If you are subject to the AMT, it is often best to delay payment on the disallowed deductions and push them off until 2016 or later tax years (when AMT is no longer an issue). It is always possible you might be able to use the deductions next year. Therefore, we suggest that you talk with your tax preparer about AMT prior to using any of the deduction and exemption strategies we have mentioned.
Conclusion
 One of our primary goals is to keep clients aware of tax law changes and updates. This report is not a substitute for using a tax professional. In the 1980’s, one teenager was preparing his tax return. He came across a negative number that he had to put in, and there was nothing in the instructions about dealing with negative numbers, so he just left it the way it was. His tax refund amounted to roughly $30. The IRS did not accept his return because according to them he was supposed to put “0” anywhere there was a negative number, even though there was nothing written in the instructions. The IRS showed the instructions for the next year’s tax return which did specify that rule. After many years of writing back and forth, the taxpayer finally went to the local IRS and proved to the IRS agent that he was right. He finally got his refund years later after many hours wasted on explaining his situation to the IRS. (Source: efile.com)
Please note that many states do not follow the same rules and computations as the federal income tax rules. Make sure you check with your tax preparer to see what tax rates and rules apply for your particular state.
There are many other additional tax reduction strategies that will vary depending on your financial picture. We encourage all of our clients and prospects to come in so that we can review your particular situation and hopefully take advantage of those tax rules that apply to you.
The views expressed are not necessarily the opinion of FSC Securities Corporation, and should not be construed, directly or indirectly, as an offer to buy or sell any securities mentioned herein. This article is for informational purposes only. This information is not intended to be a substitute for specific individualized tax, legal or investment planning advice as individual situations will vary. For specific advice about your situation, please consult with a financial professional. Contents Provided By the Academy of Preferred Financial Advisors, Inc. Reviewed by Keebler & Associates. © Academy of Preferred Financial Advisors, Inc.
Economic Update – Third Quarter 2015
 This past quarter was a difficult one for even the smartest of investors. Many money managers were hoping for a chance to purchase equities at cheaper prices, however they forgot the old adage, “Be careful what you wish for.” Those money managers learned that lesson this quarter. For nearly four years,
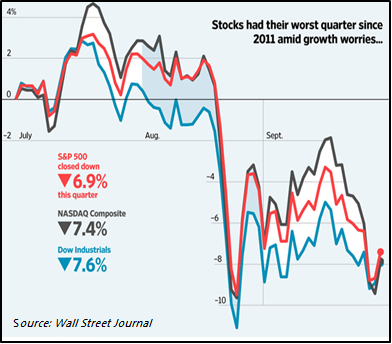
stocks had been heading in one direction—up—and some money managers were all but begging for a selloff so they could purchase great companies at bargain-basement prices. They got their chance in August when the Standard & Poor’s 500 index officially entered a correction—defined as a decline of 10% or more—with some of the market’s most revered companies declining in price for little or no reason.
After several healthy years the equity markets have taken a break from their continuous upward movements. For the quarter, the Standard and Poor’s 500 index fell 6.9%, leaving most investors with losses. This was the index’s worst quarter since 2011. After a few years of what now is being referred to by many as slow, calm and steady movements, the stock market has returned to some of the most gut-wrenching price swings since the 2007-2009 financial crisis. (Source: Wall Street Journal, 9/30/2015)
Although most long term investors understand that over long periods of time the equity markets can provide reasonable returns, the market swings of this past quarter have been confusing and even some of the most disciplined investors have been afraid to buy on the dips. During these times, Vanguard Investments reminds investors that, “It’s natural to have lots of questions when the market swings up and down. Volatility is common, and often the wisest thing to do is stick with your investment plan.” They go on to reason that in highly volatile market environments investors need to remember what they refer to as market volatility Rule #1: Recognize that volatility and periodic corrections are common in equity markets. Vanguard suggests that the key to getting through unexpected turbulence is to understand that swings in the financial market are normal—and relatively insignificant over the long haul. (Source: Vanguard.com, 9/2015)
Market pull backs are not a new concept but now that it’s Fall, investors are bracing for additional large price swings across stocks and bonds heading into a month that is usually associated with market tumult. Although the markets are down, many analysts said other signals of a U.S. recession haven’t materialized. They still expect the U.S. economy to expand at a modest but healthy 2.5% annual rate this year and point out that unemployment is at its lowest levels since early 2008. Consumer spending, another major growth driver, is strengthening. (Source: Wall Street Journal, 9/30/2015)
The S&P 500 is down more than 5% since the end of July. This means that the S&P 500 trades at 16.7 times the past 12 months of earnings, compared with its 10-year average of 15.7, according to FactSet. In early August, before the S&P 500 fell into correction territory, it traded at 18.2 times the past year of earnings.
 Commentary from some market strategists seems to be less upbeat than in past years, however overall it still remains optimistic. The main dissention in the group is over how fast and how far markets will move. “U.S. stock valuations are reasonable given the prospects for growth and inflation,” says Russ Koesterich, Global Chief Investment Strategist at Blackrock, who worried about “stretched” valuations in December. Near term he feels stocks are still “particularly attractive relative to bonds.” Dubravko Lakos-Bujas, Chief U.S. Equity Strategist at JPMorgan Chase agrees. He feels that compared with International markets, the U.S. provides stocks of superior quality. (Source: Barron’s, 9/7/2015)
Analysts are cautious for now, but among 21 strategists followed by Birinyi Associates, the average S&P 500 price target for 2015 is currently 2177. If it ends the year at that level, it would mark a gain of 5.8%, lower than the 8.4% increase forecast in the middle of this year, but still up. (Source: Wall Street Journal, 9/30/2015)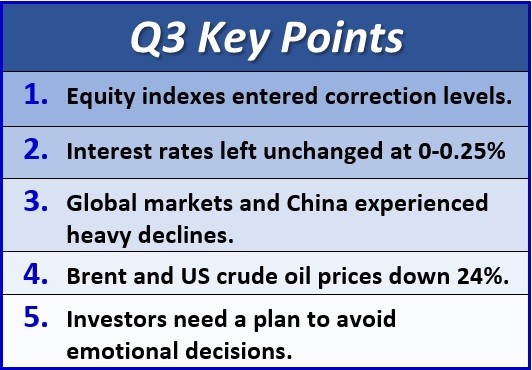
Interest Rates
Will the Fed raise rates or won’t they? That still remains the main question when it comes to interest rates. Despite the insistence that they were using a monetary based policy to decision making, every time analysts felt the Fed was going to raise interest rates, they came away feeling like participants in the movie Groundhog’s Day.
All throughout the quarter Janet Yellen and her colleagues took a wait—and—see approach which analysts feel contributed to the market’s volatility. When it was all said and done the Federal Open Market Committee left the Federal Funds rate (the rate banks charge each other for overnight loans of funds maintained at the Fed) unchanged at 0%—0.25%. They also left no clear direction as to exactly when they would raise rates. While they spoke of raising them before year-end, they also said they would have to carefully watch several factors like the job market and the risks created by overseas turmoil. Without decisive action from the Fed, or greater clarity about its intentions, analysts are predicting the markets will continue to be volatile. (Source: Barron’s, 9/21/2015)
History has shown that the first interest-rate hike in a Federal Reserve tightening cycle is not the start of a market or economic downturn. In the past, economically sensitive assets, such as equities, have performed well during the period immediately after the initial hike. A Fed rate hike might also remove the unclear feeling that some investors may have about monetary policy and the U.S. economy, which may have the offsetting impact of boosting investor confidence. Even if later this year in October or December, the Federal Reserve issues its first interest rate hike in over nine years, analysts feel it won’t give the economy a sharp kick. They are suggesting it will be more of a gentle nudge, though significant. Once again investors will need to keep a watchful eye on interest rate movements. (Source: Fidelity 10/2015)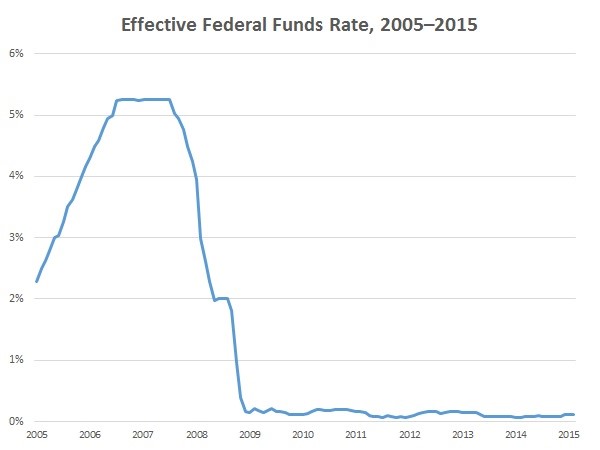
Global Concerns & China
This quarter, global markets and investors also experienced difficulties. Global stock markets saw their weakest quarterly performance in four years with trouble predicted in the world’s two largest economies. After a sustained collapse in commodity prices, China’s equity markets dropped and then Chinese officials announced a shocking currency devaluation. Continued fears of a Greek default made the past three months a summer to remember (or forget) for investors.
“Global equities are closing in on their worst quarter since 2011, with a number of factors fueling fears in an already jittery market, including weak global growth, driven by deceleration in emerging markets, particularly China,” Barclays analysts said in a late September report. China’s benchmark Shanghai Composite appeared to be one of the world’s worst performers of the quarter with a 25% loss, its weakest performance since 2008. In Europe, Germany’s Dax experienced a 15% decline, -11% for the French CAC, -8% for Italy and -13% for Spain’s IBEX. Moving forward, many analysts are expecting a cloud of pessimism to loom over global equity markets for a while. (Source: CNBC, 9/30/2015)
Oil Prices
Oil prices have fallen a long way over the last year. For the quarter, both Brent and U.S. crude oil were down 24% for their sharpest decline since the end of 2014. Heading into the fourth quarter, analysts are predicting that energy markets should stabilize as production in the U.S. subsides. The falling of oil prices has both positive and negative impacts on the economy. On the negative side, prices of oil stocks and employment in oil and oil-related industries has declined. This hit to the energy sector has taken a toll on the earnings of oil related stocks and has delayed or canceled many of their planned capital expenditures. On the positive side, consumer relief at the pumps will hopefully turn into more savings or ability to spend for consumers.
Analysts also feel that it now appears the majority of the damage has been done and oil prices may be stabilizing. Oil prices contributed to the market’s decline and are another concern that need to be monitored by investors. (Source: Seeking Alpha 10/4/2015)
Conclusion: What Can an Investor Do?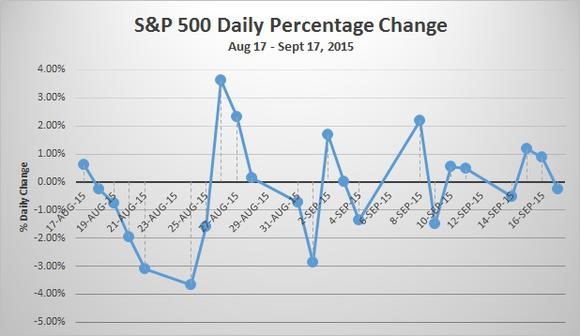
The more often you update yourself on the market’s fluctuations, the more volatile and risky it will appear to you — even though short, sharp declines of 5% to 25% are common. The U.S. stock market has, in the past few years, been extraordinarily placid by historical standards. Even the sudden drops of the past month are well within the long-term norm. Fixating on fluctuations in the short term will make it harder for you to remain focused on your long-term investing goals. (Source: Wall Street Journal, 9/30/2015)
Have a plan. Even the savviest of investors need a plan. When equity markets are gyrating on a daily basis it is easy to make emotional decisions that could prove to be wrong.
Focus on your own personal objectives. During confusing times it is always wise to create realistic time horizons and return expectations for your own personal situation and to adjust your investments accordingly. Understanding your personal commitments and categorizing your investments into near-term, short-term and longer-term can be helpful.
Don’t try to predict the market. Investment decisions driven by emotion can cause problems for investors. Discipline and perspective can help investors remain committed to their long-term investment programs through periods of market uncertainty. The best investors try not to constantly look back and second guess their decisions. They make decisions based on facts and data points.
A portfolio strategy can assist in helping you weather ups and downs of the market. Corrections are a normal part of investing. With a strong plan in place, many investors need not worry or adjust their approach at all. Even for those who are retired, it’s helpful to consider an income strategy that includes enough regular flow of money—including Social Security, pensions, or other income sources—to cover housing, food, and other essential & discretionary expenses whether the market is up or down.
Make sure you have adequate liquidity. When the market is down, cash can be a valuable shock absorber. You may want to consider using the cash portion of your portfolio to delay the need to sell equities while the market is down. Selling equities in a downturn leaves you with less invested when a recovery comes, turning what may be a temporary market decline into a permanent “dent” in your portfolio. Having cash on hand may help give you the opportunity to participate in a recovery.
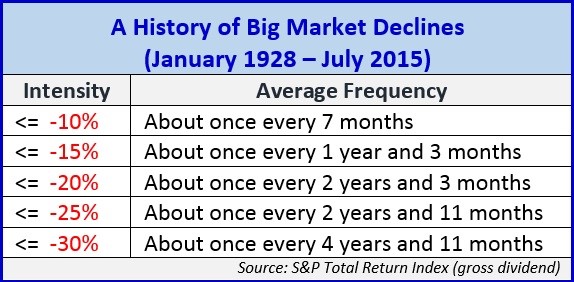 Get used to volatility. As the chart of market declines shows, volatility and market declines are a part of investment history. Legendary investor Warren Buffett maintains that, just because markets were volatile doesn’t mean that for a long-term investor — which is the prism through which Buffett sees markets — the stock market was necessarily riskier. He advises investors not to confuse volatility with risk.
As always, discuss any concerns with us.
Our advice is not one-size-fits-all. We will always consider your feelings about risk and the markets and review your unique financial situation when making recommendations.
We pride ourselves in offering:
- consistent and strong communication,
- a schedule of regular client meetings, and
- continuing education for every member of our team on the issues that affect our clients.
A good financial advisor can help make your journey easier. Our goal is to understand our clients’ needs and then try to create a plan to address those needs. We continually monitor your portfolio. While we cannot control financial markets or interest rates, we keep a watchful eye on them. No one can predict the future with complete accuracy, so we keep the lines of communication open with our clients. Our primary objective is to take the emotions out of investing for our clients. We can discuss your specific situation at your next review meeting or you can call to schedule an appointment. As always, we appreciate the opportunity to assist you in addressing your financial matters.
 P.S. Janet Yellen is plotting the monetary future using complex data points that consider inflation, employment, and productivity. But one strategist is resorting to more tangible evidence: bacon cheeseburgers.
Nicholas Colas, chief market strategist at Convergex, a global brokerage based in New York, tracks “off the grid” economic indicators. He found that measuring the prices of ingredients in a bacon cheeseburger can determine the impact of inflation.
Colas tracked prices for ground beef, cheese, and bacon since 1980—he left off the bun “in deference to history and those on a low-carb diet.” It turns out the bacon-cheeseburger index reveals deflation over the past few months. On a year-over-year basis, the ingredients fell 2.9% in June, 1.2% in July, and 2.7% in August. Historically, bacon-cheeseburger deflation has signaled a slowing economy, he notes.
“Go back through the price history, and negative 3% to 4% price declines for bacon cheeseburgers are often a sign that the Fed needs to cut interest rates and push liquidity into the domestic economy. I know that sounds weird, but the last time our bacon cheeseburger showed negative price trends of this magnitude was in 2009. Before that, it was 1998 [Asia crisis] and 1991-92 [Gulf War I].”
Will Yellen heed the warning and delay rate hikes? Colas urges her to sink her teeth into this issue, “Even if bacon cheeseburgers aren’t on the cafeteria menu at Fed HQ, Chair Yellen would do well to heed the sizzle of deflationary pressures.” (Source: Barron’s, 10/2/2015)
Note: The views stated in this letter are not necessarily the opinion of FSC Securities Corporation and should not be construed, directly or indirectly, as an offer to buy or sell any securities mentioned herein. Investors should be aware that there are risks inherent in all investments, such as fluctuations in investment principal. With any investment vehicle, past performance is not a guarantee of future results. Material discussed herewith is meant for general illustration and/or informational purposes only, please note that individual situations can vary. Therefore, the information should be relied upon when coordinated with individual professional advice. This material contains forward looking statements and projections. There are no guarantees that these results will be achieved. There is no guarantee that a diversified portfolio will outperform a non-diversified portfolio in any given market environment. All indices referenced are unmanaged and cannot be invested into directly. Unmanaged index returns do not reflect fees, expenses, or sales charges. Index performance is not indicative of the performance of any investment. Past performance is no guarantee of future results. The Standard and Poors 500 index is a capitalization weighted index of 500 stocks designed to measure performance of the broad domestic economy. Through changes in the aggregate market value of 500 stocks representing all major indices. The Dow Jones Industrial average is comprised of 30 stocks that are major factors in their industries and widely held by individuals and institutional investors. Due to volatility within the markets mentioned, opinions are subject to change without notice. Information is based on sources believed to be reliable; however, their accuracy or completeness cannot be guaranteed. In general, the bond market is volatile, bond prices rise when interest rates fall and vice versa. This effect is usually pronounced for longer-term securities. Any fixed income security sold or redeemed prior to maturity may be subject to a substantial gain or loss. © The Academy of Preferred Financial Advisors, Inc. Sources: Wall Street Journal, Barron’s, Vanguard, Seeking Alpha, Fidelity
Market Month: August 2015
 The Markets (as of market close August 31, 2015)

Despite favorable economic news later in the month, the U.S. stock market was unable to recover all of its losses and closed in negative territory compared to July. Key factors in the downturn include fear that China’s economy is weakening, the steep drop in the price of oil, lackluster corporate earnings reports, and the potential for an imminent interest rate hike. Each of the major market indexes listed here dropped between 6% and 7.50% for the month. The Dow, down more than 6.50%, marked its largest percentage decline since May 2010. Year-to-date, only the Nasdaq remained in positive territory–but only barely.
At the close of August, the price of gold (COMEX) was $1,134.90. Crude oil (WTI) prices remained below $50 a barrel, selling at $47.86/barrel by month’s end.
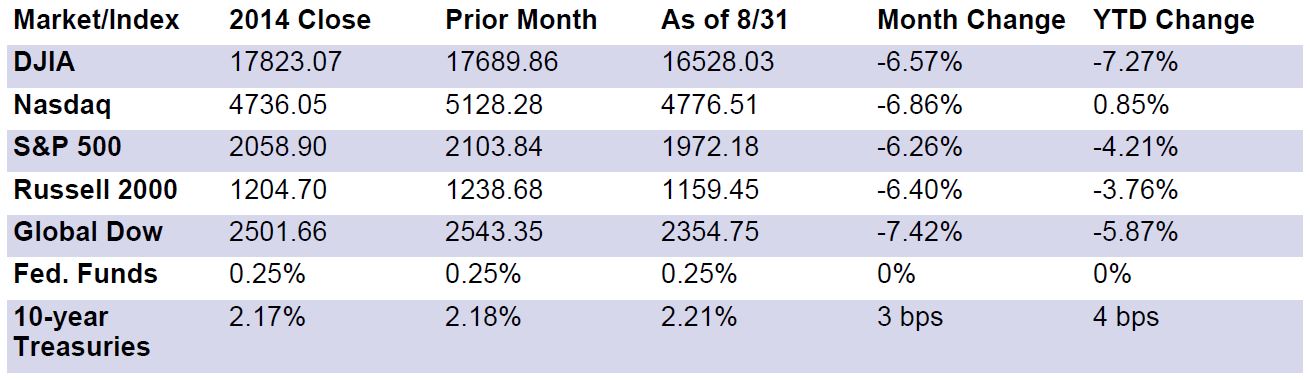 Chart reflects price changes, not total return. Because it does not include dividends or splits, it should not be used to benchmark performance of specific investments.
The Month in Review
- August saw Greece and its creditors formally agree on the terms of an 86 billion euro bailout, which may have allowed the country to remain in the eurozone. Greek Prime Minister Alexis Tsipras, despite campaign promises to write off debt and ease austerity, negotiated the terms of the new deal, which ultimately included stricter austerity measures than had previously existed. With the new debt agreement formalized and his ruling party split, Tsipras resigned, paving the way for an election likely to be held sometime in September. Nevertheless, it would appear that the latest deal has eased economic tensions in Greece, at least for now.
- August also saw China’s economy continue its dramatic slowdown, causing turmoil in stock markets around the globe. When the second-largest economy contracts, other markets feel the heat. The Chinese government has responded by cutting interest rates and lowering bank reserve requirement ratios, allowing for more money to be available to borrow for investment. It is to be determined whether these measures will increase investors’ confidence concerning China’s economic growth, which is presently predicted to be at its slowest pace in over 20 years.
- The second quarter GDP continued to expand, increasing at an annual rate of 3.7% compared to the first quarter’s growth rate of 0.6%. The second quarter showed increased consumer spending, strong residential investment, and an uptick in exports. Also of note is the GDP’s price index, which came in at 2.1%–right at the Fed’s stated policy goal of 2.0% inflation.
- Speaking of the Federal Open Market Committee, it did not meet in August, but provided enough discourse on a potential interest rate increase to draw significant attention. Nevertheless, the August release of the minutes of the committee’s July meeting revealed no clear consensus among committee members as to when rates should be raised.
- August’s U.S. Treasury report for July revealed a budget deficit of $149.2 billion, attributable, in part, to a shifting of payments up to July that had previously been scheduled for August. The total budget deficit through July 2015 was $465.5 billion, or about $5.0 billion over the same ten-month period last year.
- U.S. retail and food services sales advance estimates for July were $446.5 billion, an increase of 0.6% from June, and up 2.4% over July 2014, according to the U.S. Census Bureau. Total sales for the three-month period of May 2015 through July 2015 were up 2.3% compared to the same period in 2014.
- Inflation increased in July, but only by the slightest of margins. The overall Consumer Price Index rose 0.1% in July from a month earlier, according to the Bureau of Labor Statistics. Over the last 12 months, the unadjusted price index for all items increased by 0.2%. However, excluding the volatile food and energy components, the index has gained 1.8% for the 12 months ended July 2015.
- U.S. producers in July received slightly higher prices for their goods and services. The Bureau of Labor Statistics Producer Price Index for goods and services rose a seasonally adjusted 0.2% in July, following an increase of 0.4% in June and 0.5% in May. Even with these moderate price increases, the PPI has generally declined over the past year with overall producer prices down 0.8% compared to the 12-month period ended July 2014.
- Despite lagging a month, the Labor Department’s Job Openings and Labor Turnover Survey (JOLTS) provides useful information on the labor market–particularly job openings, hires, and separations. The number of job openings in June fell slightly to 5.25 million from 5.56 million in May. The decrease in the number of job openings may be due, in part, to an increase in the number of new hires, which rose 0.1% to 3.7%. Over the 12 month period ended June 2015, hires totaled 60.6 million while separations totaled 57.9 million, yielding a net employment gain of 2.7 million.
- Evidencing continuing weakness in goods exports, the U.S. trade deficit for June came in at $43.8 billion–up $2.9 billion from May’s revised total. Compared to May, exports for June dropped by $136 million, while imports increased by $2.8 billion.
- Imports and exports prices continue to feel deflationary pressures. Import prices for goods bought in the United States, but produced abroad fell 0.9% in July, after recording no change in June. Export prices for goods sold abroad but produced domestically were down 0.2% following a 0.3% drop in June, according to the Bureau of Labor Statistics.
- The housing market has remained a consistently performing sector. Compared to June, sales of new homes rose 5.4%, while existing home sales were up 2.0%. In both cases, demand has thinned supply to around five months.
- In other developments, for the week ended August 22, there were 271,000 initial claims for unemployment insurance, and 2,269,000 continuing claims for the week ended August 15, which yielded an insured unemployment rate of 1.7%. Compared to last month, the national average retail regular gasoline price dropped from $2.745 per gallon on July 27, 2015, to $2.637 per gallon on August 24–a fairly significant decrease of $0.108. Overall, consumer confidence rebounded in August, increasing to 101.5 compared to 90.9 in July, according to The Conference Board’s Consumer Confidence Index.
Eye on the Month Ahead
China’s tumbling stock market clearly impacted U.S. stocks in August. Market recovery in September will be tied, at least in part, to whether China can boost its sagging economy. The results of the FOMC meeting in September may finally provide a firm indication of when interest rates will be increased and by how much. It appears that as the third quarter comes to a close, market volatility may continue.
Data sources: Economic: Based on data from U.S. Bureau of Labor Statistics (unemployment, inflation); U.S. Department of Commerce (GDP, corporate profits, retail sales, housing); S&P/Case-Shiller 20-City Composite Index (home prices); Institute for Supply Management (manufacturing/services). Performance: Based on data reported in WSJ Market Data Center (indexes); U.S. Treasury (Treasury yields); U.S. Energy Information Administration/Bloomberg.com Market Data (oil spot price, WTI Cushing, OK); www.goldprice.org (spot gold/silver); Oanda/FX Street (currency exchange rates). News items are based on reports from multiple commonly available international news sources (i.e. wire services) and are independently verified when necessary with secondary sources such as government agencies, corporate press releases, or trade organizations. All information is based on sources deemed reliable, but no warranty or guarantee is made as to its accuracy or completeness. Neither the information nor any opinion expressed herein constitutes a solicitation for the purchase or sale of any securities, and should not be relied on as financial advice. Past performance is no guarantee of future results. All investing involves risk, including the potential loss of principal, and there can be no guarantee that any investing strategy will be successful.
The Dow Jones Industrial Average (DJIA) is a price-weighted index composed of 30 widely traded blue-chip U.S. common stocks. The S&P 500 is a market-cap weighted index composed of the common stocks of 500 leading companies in leading industries of the U.S. economy. The NASDAQ Composite Index is a market-value weighted index of all common stocks listed on the NASDAQ stock exchange. The Russell 2000 is a market-cap weighted index composed of 2,000 U.S. small-cap common stocks. The Global Dow is an equally weighted index of 150 widely traded blue-chip common stocks worldwide. The U.S. Dollar Index is a geometrically weighted index of the value of the U.S. dollar relative to six foreign currencies. Market indices listed are unmanaged and are not available for direct investment.
Economic Update – Second Quarter 2015
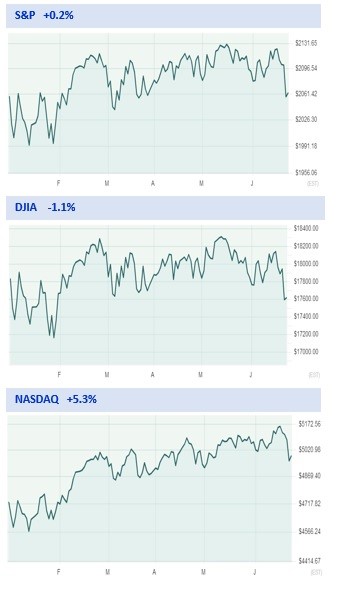 With the most recent stock market volatility, many investors are looking over their shoulders and wondering if the gains of the past few years are in jeopardy. Many market strategists predicted that volatility would return to the equity markets in 2015 and the first half of the year has supported those forecasts.
Despite all three major indexes hitting new highs this quarter, only the NASDAQ finished the first half of 2015 with much of a gain. By the end of the quarter, the Dow Jones Industrial Average was negative, down 1.1% for the year. The S&P 500 index finished up 0.2%, or about where it started. The NASDAQ rose approximately 5.3% for the first half of 2015.
There continues to be talk and debate amongst financial analysts and publications about the remainder of 2015. At Barron’s midyear roundtable, the annual gathering of 10 investment market strategists felt that although the market isn’t cheap, they were still optimistic about the remainder or 2015. Some analysts are saying a long over-due correction is imminent. According to CNN Money, the U.S. stock market is long overdue for a big fall, but the solution isn’t to exit stocks. Instead, they suggest that there may be opportunities during market dips. They remind investors that stocks often go up after a correction. Corrections do not always mean the bull market is done. (Source: CNNMoney 6/4/2015)
According to Jeff Reeves at Market Watch, a market correction is not ‘due’. He suggests that perhaps the most important data point of all for the bears to remember is that rallies do not end simply because they’ve gone on for a few years and are “due” to correct. To support this theory, he suggests investors study the bull market of 1987 to 2000, which lasted 4,494 days and saw a roughly 585% increase in the S&P 500. He adds that this is not to discourage investors from thinking critically or skeptically about the numbers. Obviously, it’s human nature to wonder when the party is going to end, but he warns against predicting the end just because we’ve had a long run-up. (Source: MarketWatch, 6/15/2015 )
Interest Rates
Again this quarter, interest rates and Fed watching continues to feel like a spectator sport for investors. Investors are carefully watching federal funds rates in anticipation of a rate increase. Fed statements, notes and pre- and post- meeting discussions have been monitored and debated by most financial media professionals and outlets.
The federal funds rate is an important benchmark in financial markets. It is the interest rate that the borrowing banks pay to the lending banks to borrow funds. It is negotiated between the two banks, and the weighted average of this rate across all such transactions is the federal funds effective rate.
According to CNBC on June 23rd, Federal Reserve Governor Jerome Powell, a voting member on the policy-setting committee said he sees conditions for an interest rate liftoff as soon as September and an additional increase in December. Powell added that he believes the dollar and oil prices have broadly stabilized. He estimated the economy will grow at around a 2 percent pace this year. Powell said he’s seen positive signs in the economy, including a pickup in wages and an uptick in the labor participation rate. (Source: CNBC.com, 6/23/2015)
Currently, interest rates and the Federal Funds rate are at the center of many discussions for investment decisions. To combat the financial crisis of 2008, the previous Federal Reserve Chairman Ben Bernanke lowered the rate by aggressively dropping it ten times in 14 months. The Federal Reserve policymakers have kept the Federal Reserve funds rate at near zero since December 2008 in an attempt to stimulate economic growth. Although the economy has still not fully recovered, it is stronger, suggesting that a small interest rate move is coming. Having said that, here are some common questions about interest rates and how the central bank uses them to try to help the economy.
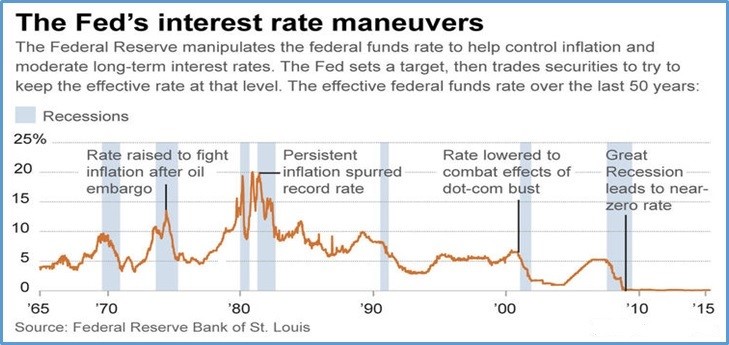 Exactly what interest rate is the Fed looking to raise?
When you hear that the Fed is raising interest rates, they are referring to the federal funds rate. The reserves that banks are required to hold at the Fed are known as federal funds. Because these funds fluctuate daily, banks with a surplus of funds lend money overnight to banks with a shortfall. The interest rate that banks use for these overnight loans is known as the federal funds rate.
How does the Fed control the federal funds rate?
The decision to change the target federal funds rate is overseen by the 12 members on the Federal Open Market Committee, better known as the FOMC. Centered on the prevailing economic conditions, the committee votes on the desired target interest rate that they believe will help keep the economy running smoothly. Consistently, the targeted interest rate has always been a specific number. But since 2008, the targeted rate has been between zero to 0.25%.
Why does the Fed maneuver the federal funds rate?
The FOMC’s goal is to use the federal funds rate to prevent unnecessary shocks to the overall economy. Congress enacted the Federal Reserve with control over the federal funds rate to provide maximum employment, keep inflation low, and provide reasonable long-term interest rates. When the economy is straining, the federal funds rate is lowered to reduce borrowing costs for banks to help stimulate lending and increase economic activity. If the economy is growing too quickly, the rate is increased to raise borrowing costs and curb any growing inflation.
The FOMC alters the rate to find a balance between economic growth and low inflation. Committee members keep a close eye on economic indicators to help them establish whether the economy is speeding up too quickly (causing inflation) or slowing down and shrinking (forming a recession). Fed policy makers raised the interest rate up to 20% in 1980-81 to stop runaway inflation during that time. And when the Great Recession hit in 2008, the Fed dropped rates as low as possible to the zero lower bound – from zero to 0.25%. The Fed hasn’t raised rates since June of 2006 when the federal funds rate was 5.25%.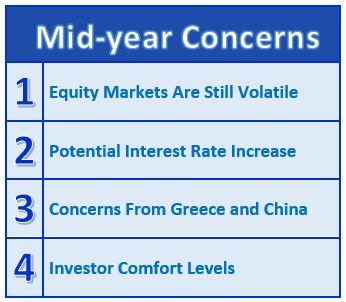
How does the federal funds rate affect other interest rates?
While the federal funds rate is only directly applicable to banks that lend to one another, it has become a benchmark for consumer and business loan rates. Business executives and investors keep a close eye on the federal funds rate and the FOMC’s position on the economy to help them adapt their business plans accordingly.
The prime rate, for example, is established by banks and is offered to their best customers. It is used to determine interest rates for a variety of loans, including credit cards, car loans, small business loans, and home equity lines of credit.
While the Fed has no direct control over the prime rate, it has historically been three percentage points higher than the federal funds rate. When the Fed lowered the benchmark rate from 0.75% to near zero in 2008, banks followed in turn and lowered their prime rate from 4% to 3.25%.
Does the federal funds rate influence mortgage rates?
Because most mortgages are longer term and are affected more by supply and demand of the mortgage market, the federal funds rate has less of a direct effect. However, the federal funds rate can and does influence the mortgage market. Individual mortgages are regularly packaged into investment securities that are traded throughout the economy. The Fed can actually purchase these securities to drive up demand. This is known as quantitative easing. The Fed performed several rounds of quantitative easing after the housing market crash in 2007 by purchasing hundreds of billions of dollars in mortgage-backed securities and Treasury bonds to help lower mortgage rates and increase home value. Some analysts also say that long-term rates reflect the direction of a series of short-term interest rate changes. Therefore, multiple increases of the federal funds rate could raise mortgage and other long-term rates higher.
We still live in a slow-growth, low inflation world that is likely to keep interest rates low for the immediate future. Currently, 27 of the world’s 34 major central banks are making an effort to suppress interest rates. Investors need to keep a watchful eye on interest rates, but also need to avoid over focusing on rate hikes. (Source: Fidelity 6/5/2015)
Should you have any concerns about your holdings we would be glad to recheck your personal situation during your next review or at any other time.
Greece’s Monetary Issue
The 2008 financial crisis put a strain on Greece’s fiscal budget, which was already in poor shape. In 2010, the Greek government took billions of euros in bailout money from the European Union and International Monetary Fund. The lenders required Greece to implement heavy spending cuts and tax increases, which then created skyrocketing unemployment and plummeting living standards.
Since then, Greece has faced a choice: either stick with the bailouts and endure the pain of austerity, or reject the terms of the bailout — likely leading to default and, possibly, leaving the Eurozone entirely.
Greeks elected a new government in January 2015 that opted for a third option: renegotiating the terms of the bailout to require less severe austerity measures. This strategy failed, partly because Greek leaders have no leverage, and partly because European politicians feared that granting Greece’s demands would anger other countries who’ve accepted bailout money — like Spain, Portugal, or Ireland.
While this issue is still outstanding as of the quarter’s end, the Greek government has officially imposed capital controls to try to contain the economic crisis. That means, for example, that it has shuttered all banks until after the referendum on the bailout deal and issued strict regulations on other use of financial institutions. ATM withdrawals are limited to €60 per day, per account. Transfers of money outside Greece are banned and exceptions require Finance Ministry approval. Pension and wage payments are to proceed as normal, as does internet banking and debit card transactions.
The basic reason behind these rules is to prevent bank runs. If people take too much cash out of the country’s banks, then they’ll cease being able to make loans and the country will fall into a financial crisis.
Greek citizens have strong reasons to want to take their money out of the banks. Deposits could be raided to help keep banks solvent, as happened in Cyprus. Another possibility is that Greece could abandon the euro, convert all deposits into its new currency (probably the drachma, the country’s pre-euro currency), and then devalue that currency dramatically.
If Greece vanished today, the world economy would contract 0.3 per cent, once. Economically, the loss would scarcely be noticed. Since Greece has only 11 million people, a financial crisis wouldn’t be the same as a United States or global financial crisis. It is not big enough to hurt. (Source: NBC World News)
How will the Greek issues affect the markets?
In reaction to Greece’s concerns, the Dow plummeted 350 points June 29th, its worst day of the year. Some analysts believe the effect may be short-lived: S&P Capital IQ published a 70-year historical analysis of past market shocks that found events like this produce an average decline of 2.4 percent on the next trading day, which has been recovered in an average of 14 trading days.
“Greece represents less than 2 percent of the EU’s GDP,” S&P strategist Sam Stovall wrote. “By itself, its default or exit won’t upend the EU. … Yet if this drachma drama triggers a market decline in excess of 10 percent, not seen since October 2011, it may be a blessing in disguise. As history has shown, prior market shocks have usually proven to be better opportunities to buy than bail, primarily because the events did not dramatically alter the course of global economic growth.” (Source: NBC World News)
China’s Equity Markets
China had a tumultuous quarter. The economy continued to slow, growing only 7% in the first quarter, the slowest in six years. Some analysts are concerned that what happens in the Shanghai stock market may not stay there.
The Shanghai Composite, which was a rising star for the last year, is off nearly 22% from its peak in mid-June, including a 3.3% fall on June 29th. China’s interest-rate cut on the prior weekend did little to restore investor confidence.
Historically, the movements of China’s stock market have had little impact on the broader economy. After the last Chinese equity bubble burst in 2007 to 2008, China’s stock prices were low for more than five years. During this same time period China posted impressive GDP growth rates.
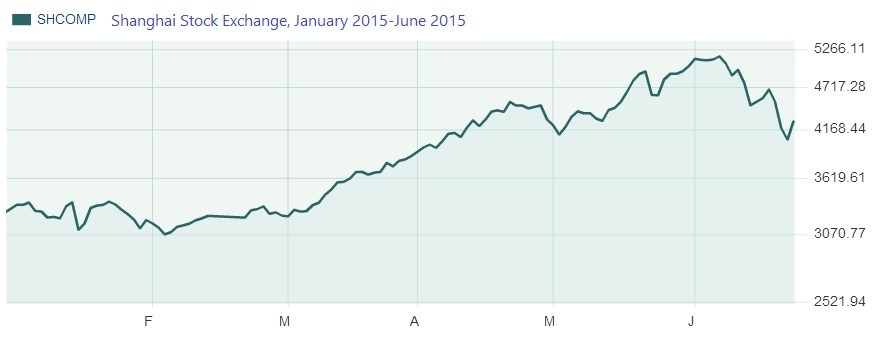 The Chinese government has been pulling a number of levers to try to stimulate the economy. Despite this uncertain growth picture, the Shanghai SE Composite Index, despite falling 7.3% in the last month, has gained 14.1% in the last three months, and 32.2% for the year to date.
Fewer than 10% of Chinese households own shares, compared with more than half of American ones. The “wealth effect” that is seen in the U.S. and other developed countries, whereby households tend to feel wealthier when stocks rise, or poorer when they fall, and adjust their spending plans accordingly, hasn’t been as strong in China. However, some analysts are warning that it would be a mistake to assume that China will shrug off this market meltdown. (Sources: Morningstar 7/1/2015, Wall Street Journal 6/29/2015)
Conclusion: What Should an Investor Do?
Investors are concerned about return. After all, the market has been up. On June 24th, in an article entitled Will the DJIA hit 16,000 or 20,000 first?, the Chief Market Strategist for Convergex noted that the Dow Jones Industrial Average was up 324 points for the year to date – which meant an increase of 1.8%. Although there are 30 companies in this oldest broad market measures, just 2 names made up all that performance (and then some, actually). Goldman Sachs was up 12% year to date, adding 174 points to the Dow and UnitedHealth’s 21% return was worth another 164. You’d think it would be the other way around, but GS’s higher stock price gives it a heftier weighting. The other 28 names in the Dow netted out to zero impact for the year. (Source: www.convergex.com)
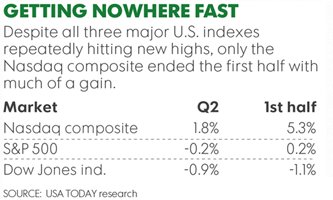 The first half of 2015 was not easy for investors. By many measures, the equity markets are not cheap. However, experts are still upbeat for 2015. As advisors, we are faced with the tough task of balancing portfolios between risk free rates, risk premiums and market returns. (Source: Fidelity 6/15/2015)
So what can investors do?
Safety comes with a price. Rates on longer-term certificates of deposit got a small bump in Bankrate.com’s June 24 survey of interest rates. The average one-year CD yield was 0.27% for the 15th straight week. The typical five-year yield was up 1 basis point to 0.87% (a basis point is one-hundredth of 1%). Jumbo CDs sport slightly higher yields for a $100,000 deposit. The average one-year jumbo CD yield was 0.3% for the seventh consecutive week. The average five-year CD yield was up 1 basis point to 0.92%.
For the 37th week in a row, the average money market account yield was 0.09%. (Source: www.bankrate.com)
For many investors these low fixed rates will not help them achieve their desired goals. Most investors attempt to build a plan that includes risk awareness. Many times this can lead to lower but safer returns. Traditionally, bonds have been the de facto standard to hedge against market risk, but with bond values at historical highs they no longer offer the kind of protection they once did and quite possibly pose a greater threat of loss than stocks. Investing is not about keeping pace with the market (who likes losing 40% during years like 2008?) or beating the market – it’s all about hedging risk so your portfolio suits your individual needs regardless of the market.
Have a Strategy. Investors need to be prepared. Market volatility should cause you to be concerned, but panicking is not a plan. Market downturns do happen and so do recoveries. This is the ideal time to ensure that you fully understand your time horizons, goals and risk tolerances. Looking at your whole picture can be a helpful exercise in determining your strategy.
Focus on your own personal objectives. During confusing times it is always wise to create realistic time horizons and return expectations for your own personal situation and to adjust your investments accordingly. Understanding your personal commitments and categorizing your investments into near-term, short-term and longer-term can be helpful.
Make sure you are comfortable with your investments. Equity markets will continue to move up and down. Even if your time horizons are long, you could see some short term downward movements in your portfolios. Rather than focusing on the turbulence, you might want to make sure your investment plan is centered on your personal goals and timelines. Peaks and valleys have always been a part of financial markets and it’s highly likely that trend will continue.
Discuss any concerns with us.
Our advice is not one-size-fits-all. We will always consider your feelings about risk and the markets and review your unique financial situation when making recommendations.
We pride ourselves in offering:
- consistent and strong communication,
- a schedule of regular client meetings, and
- continuing education for every member of our team on the issues that affect our clients.
A good financial advisor can help make your journey easier. Our goal is to understand our clients’ needs and then try to create a plan to address those needs. We continually monitor your portfolio. While we cannot control financial markets or interest rates, we keep a watchful eye on them. No one can predict the future with complete accuracy, so we keep the lines of communication open with our clients. Our primary objective is to take the emotions out of investing for our clients. We can discuss your specific situation at your next review meeting or you can call to schedule an appointment. As always, we appreciate the opportunity to assist you in addressing your financial matters.
 Note: The views stated in this letter are not necessarily the opinion of FSC Securities Corporation, and should not be construed, directly or indirectly, as an offer to buy or sell any securities mentioned herein. Investors should be aware that there are risks inherent in all investments, such as fluctuations in investment principal. With any investment vehicle, past performance is not a guarantee of future results. Material discussed herewith is meant for general illustration and/or informational purposes only, please note that individual situations can vary. Therefore, the information should be relied upon when coordinated with individual professional advice. This material contains forward looking statements and projections. There are no guarantees that these results will be achieved. There is no guarantee that a diversified portfolio will outperform a non-diversified portfolio in any given market environment.
Due to volatility within the markets mentioned, opinions are subject to change without notice. Information is based on sources believed to be reliable; however, their accuracy or completeness cannot be guaranteed. The P/E ratio (price to earnings ratio is a measure of the price paid for a share relative to the annual net income or profit earned by the firm per share. It is a financial ratio used for valuation: a higher P/E ratio means that investors are paying more for each unit of net income, so the stock is more expensive compared to one with lower P/E ratio. All indices referenced are unmanaged and cannot be invested into directly. Unmanaged index returns do not reflect fees, expenses, or sales charges. Index performance is not indicative of the performance of any investment. Past performance is no guarantee of future results. The Standard and Poors 500 index is a capitalization weighted index of 500 stocks designed to measure performance of the broad domestic economy. The Dow Jones Industrial average is comprised of 30 stocks that are major factors in their industries and widely held by individuals and institutional investors. In general, the bond market is volatile, bond prices rise when interest rates fall and vice versa. This effect is usually pronounced for longer-term securities. Any fixed income security sold or redeemed prior to maturity may be subject to a substantial gain or loss.
Economic Update – First Quarter 2015
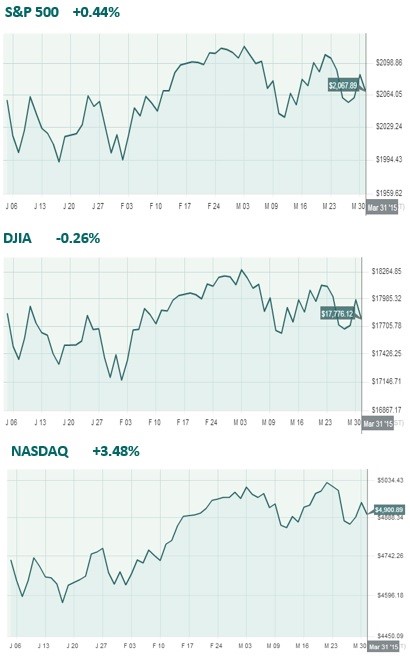 Many market strategists predicted that volatility would return to the equity markets in 2015, and the first quarter proved them right as stocks plunged, soared and then plunged again. During the first 3 months of 2015, the dollar strengthened, oil weakened, and monetary policy became a little less certain.
By the end of the quarter, the S&P 500 index finished about where it started. However, some of the movements in individual stocks and sectors were extreme. The S&P 500 rose approximately 0.4% for the first three months of 2015, but that benchmark moved at least 1% on nearly a third of the quarter’s trading days, says SunTrust strategist Keith Lerner. This statistic compares with just 15% of all trading days for 2014.
Lerner attributes these turbulent moves to the combination of factors that have become repetitive themes including the rising dollar, falling oil prices and the uncertainty surrounding Federal Reserve monetary policy. “The market can handle one or two things at one time,” he says. “We’ll get a tug of war till there is clarity.” (Source: Barron’s, 3/2015)
The fact that the market has been oscillating by macro forces does not mean that investors cannot succeed. Awareness of how these moves within currencies, commodities and interest rates could affect stocks and sectors can help investors with their decisions. The combination of all forces that took place in this first quarter actually balanced out the S&P 500 return, which is why it finished close to where it started. Still, certain industry sectors were affected more this quarter than others. Some connections are easier to see than others. For example, the energy sector has tracked the price of oil, while utilities, with their large dividends, could be more affected by a rise in interest rates. The fact that investors are concerned that the Fed will raise interest rates at some point in 2015 can help explain why utilities dropped 6% during the first three months of 2015. Similarly, the 10.6% decline in oil prices during the first quarter can be closely connected to the energy sector’s drop of 3.6%. Some sectors were less affected by some of the recent macro risks. Goldman Sachs strategist David Kostin noted that while utilities and energy sectors had high levels of macro risk, consumer discretionary and tech were less susceptible this quarter. The bottom line is still that investors should always be aware and cautious. (Source: Barron’s, 3/2015)
Interest Rates
Interest rates and Fed watching continues to play a role for investors in 2015. Ever since the Fed ended its bond buying program last October, investors have been wondering when the Fed will finally raise interest rates. There has been no clear answer and investors still need to be patient. The good news is that the uncertainty that comes before the first rate hike might cause more volatility than the rate hike itself.
The short term interest rate has been 0% since late 2008. In a speech given on Friday, March 27, Federal Reserve Chair Janet Yellen offered conditions for the central bank’s interest rate policy. She said that the initial increase from the 0% – 0.25% target range that was set for the federal-fund rate in December of 2008 should come later this year. She added that the upward trajectory of future rate hikes would be moderate and will depend on incoming economic data.
Yellen felt that equity markets were more pessimistic than the Fed and added that we should not expect a mechanical elevation in rates. She also said that if the data dictates it, the central
bank is prepared to hike rates. (Source: Barron’s 3/2015)
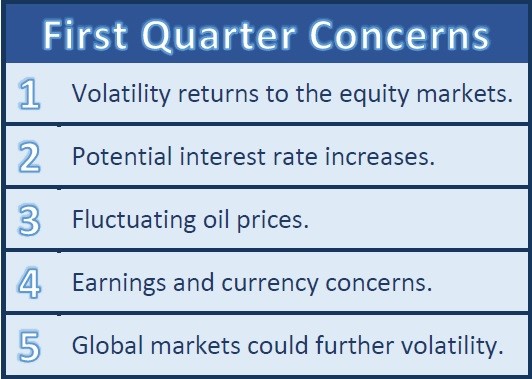 Many economists speculate that an interest rate hike is inevitable in the near future as the job market is doing well, the dollar is strong and home sale values have ticked up. “God forbid something happens in the world and the Fed needs some policy tools to try to aggressively stimulate economic growth here or abroad,” says Phil Orlando, chief equity strategist at Federated Investors. “With the funds rate at zero, they’ve got no bullets to employ. So what they want to do is reload the gun, if you will, and get back to some neutral level of the funds rate over the next couple years.”
What’s important to keep in mind is that an interest rate hike is likely still a few months off. Some say the earliest reasonable target date for a rate hike could fall in June, while others speculate the announcement will come closer to the end of this year or even sometime in 2016.
Orlando says the announcement likely will coincide with a meeting and press conference. Federal Reserve Chair Janet Yellen and the Federal Open Market Committee don’t speak with the press after each one of their meetings, so Orlando speculates that an announcement is likely to come out of their June meeting or the session scheduled for September.
If the U.S. Central Bank were to raise rates they would be going against the tide of rate cuts and other monetary-easing measures currently being taken by their counterparts abroad. Specifically, the European Central Bank announced in March the terms of its quantitative easing program. They are instituting this in the face of a negative interest rate environment.
The People’s Bank of China, housed in the world’s second largest economy, became the latest of 20-odd central banks this year to cut rates after a reduction in their growth target to “around 7%.” (Source: Barron’s 3/2015)
The changing of interest rates or even comments suggesting movements continue to create noise and news for investors. As financial professionals, we intend to be very watchful of both the Federal Reserve’s actions and interest rates this year. It seems as if everything is filtered through the lens of monetary policy. For example, when investors learned that the U.S. had added nearly 300,000 jobs in February, the S&P 500 tumbled because it signaled to some that the Fed might be forced to raise rates sooner to curb an overheating economy. Then a lackluster consumer spending report in March caused stocks to surge, because it signaled that the Fed could now afford to wait. “Everyone is playing economist, not trader,” says Michael Block, strategist at Rhino Trading Partners. (Source: Barrons, 3/2015)
Should you have any concerns about your holdings we would be glad to recheck your personal situation during your next review or at any other time.
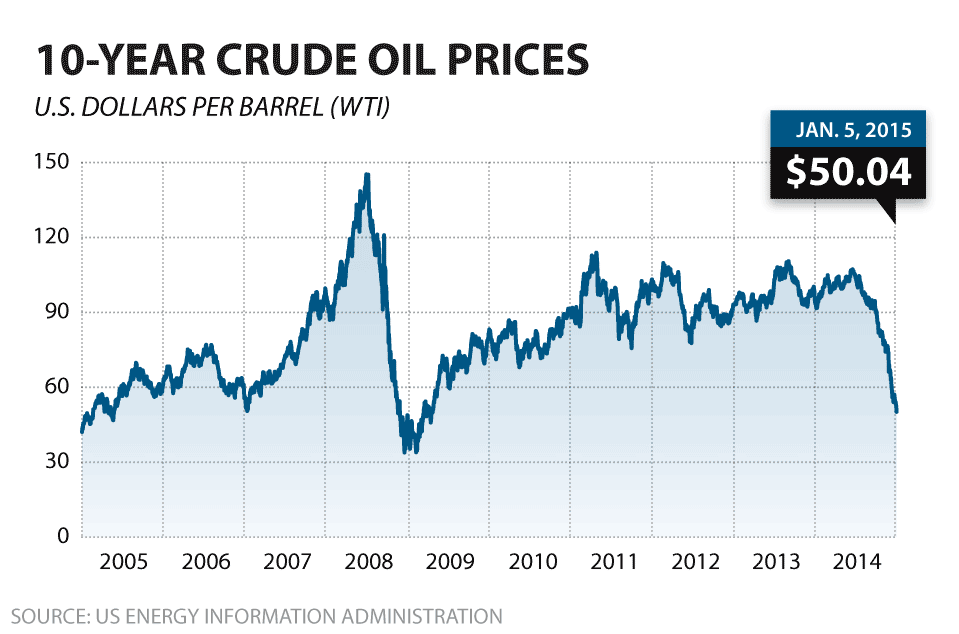 Oil Prices
Along with interest rate movements, oil prices continue to be another area that investors should pay attention to. The price of oil, down over 50% in the last seven months, is creating issues beyond even the energy markets.
Moody’s Investors Service analysts link oil’s falling prices to sectors that might benefit from increased consumer purchasing power. With oil prices down and people spending less at the pump, they should have more money in their pockets. “The average U.S. household will spend about $550 less on gas in 2015 than in 2014,” the Moody’s analysts said, citing data from the U.S. Energy Information Administration. They go on to conclude that, “oil price declines act like a tax cut enabling consumers to spend a greater percentage of their incomes on non-energy goods and services.” (Source: Barron’s, 3/2015)
Falling oil prices can hurt those extracting oil and oil service companies. They are expecting lower profits and this could affect jobs. Plummeting oil prices also add challenges for alternative energy sources like solar and wind power suppliers. Lower oil prices have resulted in a decline of many stocks dependent on energy. On the positive side, lower oil prices keep energy costs down for manufacturing companies and transportation companies.
“It’s a net positive for the U.S. economy,” says Don O’Neal, a portfolio manager at American Funds with 33 years of investment experience. He adds that, “It’s really good for the consumer and for a whole range of consumer products. But there is an offset – not all sides are benefiting from low oil prices.” (Source: American Funds, 3/2015)
The fluctuations of oil prices can continue to yield uncertainty for investors. As 2015 continues, this is another area that we will be watchful of.
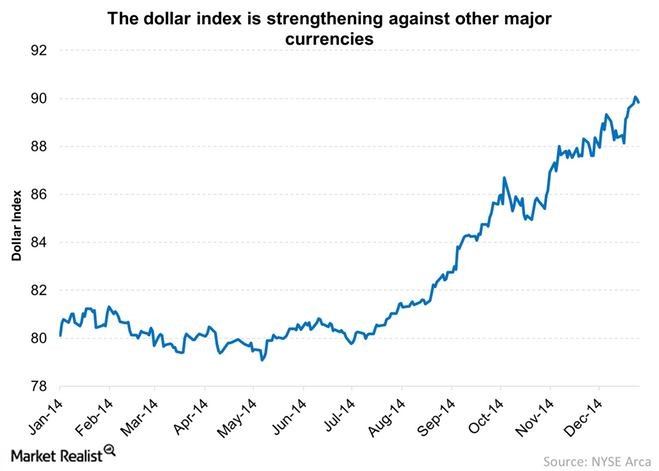 Earnings and Currency Concerns
Several market strategists are predicting a rocky earnings season for companies in the first quarter of 2015. The two biggest culprits behind the projected declines are the price of oil and the strength of the U.S. dollar.
The price of WTI (West Texas Intermediate) crude averaged $48.21 for the first three months of 2015 compared to $100.50 in the first three months of 2014, a more than 50% decline. This plunge in price means that energy sector companies have slashed their earnings guidance by 60% according to Dan Greenhaus of BTIG. He adds that overall earnings would rise 2% if you were to exclude the energy sector from the overall results. Meanwhile, the U.S. dollar index averaged $96.14 during the first quarter of the year compared to $80.33 for the same period in 2014 — a 20% year-over-year jump. While this is a great thing for Americans looking to travel or a U.S. company with little to no foreign sales, it’s bad news for a large portion of the S&P.
“The S&P 500 derives about 40% of sales from overseas, therefore relying heavily on global strength,” Christine Short, an analyst at Estimize, explained in a research note. “These companies hail from a variety of sectors — materials, industrials, information technology, consumer staples, and consumer discretionary — proving that the impact will be broad based as almost all sectors will feel forex fluctuations to some degree, with the exception of telecommunications and utilities which are mostly domestically focused,” Short explained.
S&P Capital IQ analyst Sam Stovall wrote in a recent note, “Even though the forecast for S&P 500 EPS (earnings per share) in Q1 is expected to decline 3%, history shows that actual results have been two to four percentage points higher than initial estimates.” He goes on to add that, “As a result, there is still a possibility that EPS will rise, thereby delaying the start of an EPS recession.” (Source: Forbes, 3/2015)
Global Markets
The start of 2015 has suggested that many monetary authorities were becoming responsive to weak growth outlooks and upwards pressure on their currencies. More than 20 countries eased their monetary policy already in 2015, with several countries like Sweden and Denmark even implementing negative interest rates to protect their currencies. (Source: Fidelity, 3/2015)
At the beginning of 2015, the consensus amongst most analysts was that U.S. equities were the place to be. The U.S. economy seemed to be expanding and Europe and the rest of the world did not have the same strength. A recent survey from Bank of America Merrill Lynch infers that a net 19% of global asset allocators are currently underweight U.S. stocks by the largest margins since 2008. This is a dramatic shift from their net overweight positions reported in February. (Source: Barrons, 3/2015)
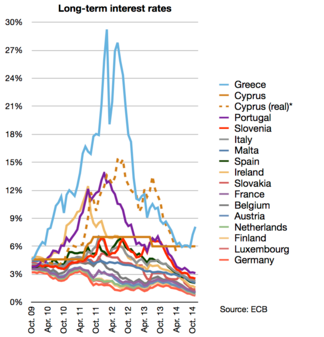 The current peaking of growth in certain countries has created cause for concern. Inflationary pressures still seem to be absent and corporate profits are still looking solid. On a positive note, the European Central Bank’s quantitative easing program has surpassed market expectations. With the Eurozone emerging from a mid-cycle slowdown, economic sentiment has moved higher in recent months. With the manufacturing sector expanding, a cheaper currency, lower oil prices and banks easing lending standards, Fidelity analysts conclude that though still slow, Europe is showing clear signs of an improving mid-cycle expansion.
After a multi-year property and credit boom, China seems to be approaching a cyclical downturn. Fidelity’s global market analysis summed up China’s economy by saying, “China continues on a decelerating trend with an elevated risk of a growth recession.”
Japan, on the other hand, seems to be in a mild recession. In April of 2014, the Japanese government implemented a consumption-tax hike that caused a downturn in demand. Although they are in a mild recession, lower oil prices and a weaker yen may have Japan’s economic woes bottoming out.
The weakness in oil has had an effect on many countries worldwide. Those countries that are leading oil exporters are obviously the ones that are being affected the most. The U.S. economy continues to be strong and although analysts are predicting a slowing effect, global growth is still on the positive side. The global backdrop coupled with the weakening of certain countries’ currencies could create further volatility for investors in 2015. While a strong dollar can benefit some sectors, it will adversely affect others. Investors should continue to be watchful of business cycle conditions in both the U.S. and overseas.
Conclusion: What Should an Investor Do?
Ultimately, predictions are just that: predictions. While investors need to be watchful of oil prices, the dollar, and even bad weather, the actual results could end up looking much different than the projections look now. So what can investors do?
Continue to be watchful. Even the most optimistic investors need to be watchful of the warning signs.
Focus on your own personal objectives. During confusing times it is always wise to create realistic time horizons and return expectations for your own personal situation and to adjust your investments accordingly. Understanding your personal commitments and categorizing your investments into near-term, short-term and longer-term can be helpful.
Revisit your risk tolerance. Investopedia defines risk tolerance as an individual having a realistic understanding of his or her ability and willingness to stomach large swings in the value of his or her investments. With the return of more frequent volatility, we would be glad to talk about any changes to your risk tolerance during your next review or at any other time.
Discuss any concerns with us.
Our advice is not one-size-fits-all. We will always consider your feelings about risk and the markets and review your unique financial situation when making recommendations.
We pride ourselves in offering:
- consistent and strong communication,
- a schedule of regular client meetings, and
- continuing education for every member of our team on the issues that affect our clients.
A knowledgeable and informed financial advisor can help make your journey easier. Our goal is to understand our clients’ needs and then try to create a plan to address those needs. We continually monitor your portfolio. While we cannot control financial markets or interest rates, we keep a watchful eye on them. No one can predict the future with complete accuracy, so we keep the lines of communication open with our clients. Our primary objective is to take the emotions out of investing for our clients. We can discuss your specific situation at your next review meeting or you can call to schedule an appointment. As always, we appreciate the opportunity to assist you in addressing your financial matters.
Note: The views stated in this letter are not necessarily the opinion of FSC Securities Corporation, and should not be construed, directly or indirectly, as an offer to buy or sell any securities mentioned herein. Investors should be aware that there are risks inherent in all investments, such as fluctuations in investment principal. With any investment vehicle, past performance is not a guarantee of future results. Material discussed herewith is meant for general illustration and/or informational purposes only, please note that individual situations can vary. Therefore, the information should be relied upon when coordinated with individual professional advice. This material contains forward looking statements and projections. There are no guarantees that these results will be achieved. There is no guarantee that a diversified portfolio will outperform a non-diversified portfolio in any given market environment.
Due to volatility within the markets mentioned, opinions are subject to change without notice. Information is based on sources believed to be reliable; however, their accuracy or completeness cannot be guaranteed. The P/E ratio (price to earnings ratio is a measure of the price paid for a share relative to the annual net income or profit earned by the firm per share. It is a financial ratio used for valuation: a higher P/E ratio means that investors are paying more for each unit of net income, so the stock is more expensive compared to one with lower P/E ratio. All indices referenced are unmanaged and cannot be invested into directly. Unmanaged index returns do not reflect fees, expenses, or sales charges. Index performance is not indicative of the performance of any investment. Past performance is no guarantee of future results. The Standard and Poors 500 index is a capitalization weighted index of 500 stocks designed to measure performance of the broad domestic economy. The Dow Jones Industrial average is comprised of 30 stocks that are major factors in their industries and widely held by individuals and institutional investors. In general, the bond market is volatile, bond prices rise when interest rates fall and vice versa. This effect is usually pronounced for longer-term securities. Any fixed income security sold or redeemed prior to maturity may be subject to a substantial gain or loss.
