Economic Update – Third Quarter 2013
Update! As of October 16, 2013, President Obama signed a bill to end the partial shutdown of the government and extend the debt ceiling until February 7, 2014. The information in this Quarterly Economic Update was based on the quarter ending September 30, 2013.
Review and Outlook
Wow! Talk about drama! Before we even get to the numbers, let’s look at the standoff between the Republicans and the White House that has resulted in the first government shutdown in 17 years. On October 1, 2013 congressional Republicans forced the shutdown with their demands to “defund” or delay the Affordable Care Act (ACA), otherwise known as “Obamacare”. At the time of this writing, Congress is still deadlocked.
Until some agreement can be reached, the shutdown has suspended all non-essential government functions. This means approximately 800,000 federal workers are at home with no pay. Another 1.3 million are still working but they will not be paid on time. The outcome is uncertain for a large number of government contractors. To give you a better idea of how this works, NASA is closed but the people supporting the astronauts currently on the International Space Station are still working. Lion-loving members of the public are currently shut out of the National Zoo, but zoo employees will continue to feed the lions!
 If history is any guide, the duration of the government shutdown matters, according to Richard Salsman, chief market strategist at InnerMarket Forecasting. Shorter government shutdowns are usually not disruptive, but longer ones are bearish, he says. There have been 17 previous shutdowns since 1976, ranging from 1 day to 26, with an average of 6 days. The S&P 500 has fallen by a mean 0.8% in past shutdowns, but for those lasting 10 days or more, a decline happened 80% of the time and averaged 2.6%. One month after the longer shutdowns ended, stocks were still down slightly, compared with the 1.7% average rise after the shorter shutdowns ended. Remember that past performance is no guarantee of future results. (Source: Barron’s, October 8, 2013, Stocks Track Washington’s Ups and Downs)
Investors are trying to gauge what is going to happen next as the government remains shut. During the first week of the fourth quarter, the broad stock market fell and rebounded daily, if not hourly, as a result of conflicting comments from senior political leaders. “It was a manic-depressive market,” says Paul Nolte, a portfolio manager with Dearborn Partners. (Source: Barron’s, October 8, 2013, Stocks Track Washington’s Ups and Downs) The shutdown “doesn’t seem to be phasing the markets all that much,” said Brian Jacobson, chief portfolio strategist for Wells Fargo Funds Management LLC, because “we’ve seen this coming from a mile away.” (Source: WSJ, October 5, 2013)
Many investors have likely become desensitized by a series of last-minute budget deals in recent years, most of which were followed by stock gains. Still, there is significant uncertainty over the extent to which the shutdown could affect economic growth and market volatility.
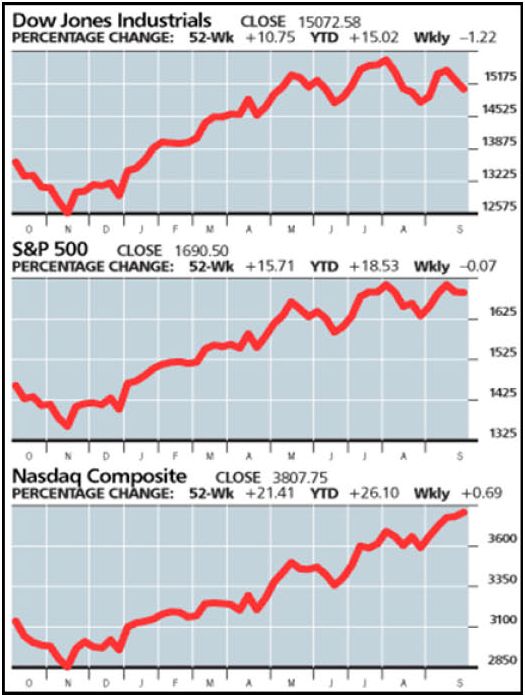
Even with all these concerns, major stock-market indexes continued their move into record territory in the third quarter. The S&P 500 gained 4.7% and headed into the fourth quarter up 18% for the year. The Dow Jones Industrial Average advanced 1.7% during the third quarter even as economic growth remained uneven. The Dow is up 14.9% for the first 9 months of 2013. The NASDAQ ended up 24.9% for the first 9 months and posted a 10.8% gain for the third quarter.
Debt Ceiling
As of October 17, 2013, the Treasury Secretary announced that the government will run out of cash and will be unable to pay its debts unless Congress first votes to raise the federal debt ceiling, which is the limit of how much money the federal government may legally borrow.
GOP leaders have stated they will agree to an increase of the debt ceiling only in exchange for a package of major budget changes, including; a delay of the health-care law, lower income tax rates, and adjustments to Medicare and Medicaid. While the White House has stated repeatedly it won’t negotiate any such agreement, many Republicans believe that this is their last chance to stop “Obamacare”, which includes big subsidies in entitlements. History suggests that such entitlements, once granted, are politically impossible to take away.
Rather than negotiate an end to the shutdown and a resolution to the debt ceiling issue, neither side has budged. The debt ceiling has been raised 74 times before. Raising it again should be routine—but what if no one backs down?
There have been warnings that a default by the U.S. government would be “catastrophic”—the government would soon begin falling behind on its bills, and this could potentially spark a financial crisis, including a stock market crash and a jump in interest rates.
America has never before found itself unable to meet its obligations. If the debt ceiling is breached, the government would have to rely solely on tax revenues, which currently cover only 84% of its expenditures. There is no question that the government would have to reduce some expenses, whether it is pensions or even interest on the National debt. However, since no politician wants to explain to grandma why her Social Security check stopped, odds are that none of this will happen—then again, looking at the mood in Congress, it’s hard to be optimistic. (Source: The Economist, October 5, 2013)
America’s government debt is considered a safe haven, which is why Uncle Sam can borrow so much so cheaply. America will not lose these advantages overnight, but an American default would cause unpredictable global repercussions. It is not just that America would have to pay more to borrow—it would threaten financial markets. Because American treasuries are very liquid and less risky, they are widely used as collateral. They make up more than 30% of the collateral that financial institutions such as investment banks use to borrow in the $2 trillion “tri-party repo” market, a source of overnight funding. A default could trigger demands by lenders for more or different collateral, which in turn could trigger a “financial heart attack” like the one caused by the Lehman Brothers collapse in 2008. (Source: The Economist, October 5, 2013)
World financial markets have already slipped on the frightening possibility that the U.S. could, in merely a few weeks, default on its debts in the absence of some agreement between the political parties. The Times of London called the “whole exercise irresponsible brinkmanship… when the world economy badly needs American leadership.” Far more worrying than these temporary effects, though, are the world’s broader doubts about American credibility and reliability. If our government can’t agree on a plan to keep the WashingtonMonument open, how can foreign powers count on the U.S. government to unite various efforts to accomplish much harder tasks internationally? Let’s face it: a superpower that can’t fund its government or pay its bills is not in a position to police problems worldwide.
The Congressional deadlock comes as our economy tries to gain traction more than four years after end of the Great Recession. Many consumers are slowly improving their personal finances. Some businesses are boosting hiring at a modest pace. The housing market is regaining lost ground and many stock indexes aren’t far off from their record highs. Many investors are more concerned with near-term decisions about the Federal Reserve’s bond-buying program than about news from Capitol Hill. In fact, confidence among U.S. consumers fell to a 5-month low this month according to a study by the University of Michigan released on Friday, September 27, 2013.
Sure, what’s happening in Washington is scary. With the government closed, the debt ceiling approaching, and an end to the standoff nowhere in sight, it’s hard to ignore the sense that a major collision is about to occur. However, as long as the default doesn’t occur, most problems will probably be short-lived.
In the meantime, the U.S. economy continues to move ahead, but at an extremely slow pace. After a recession there is supposed to be a recovery, but instead America has experienced its worst four consecutive growth years since the Bureau of Economic Analysis started compiling data in the 1930s. Recovery from the 2007-2009 Great Recession remains the slowest since World War II. Over the last three years we’ve averaged less than 2% annual growth, and in the first two quarters of 2013, the U.S. economy rose just 1.1% and 2.5%, respectively. The current GDP growth is estimated to continue at this mediocre 2.5% rate, with perhaps a slight increase in growth by mid-2014. (Source: Kiplinger’s Economic Outlook, October 2013)
Quantitative Easing
Quantitative Easing (QE) is the policy that Federal Reserve Chairman Ben Bernanke is using to promote economic recovery. Quantitative Easing has been implemented by the Fed’s $85 billion monthly bond buying (paid for with money the Fed creates out of thin air), which has kept interest rates artificially low and allowed the stock market to rally over the last 2 years. That’s an annualized rate of more than a trillion dollars. This is a breathtaking sum when you consider that the Great Recession, with its financial crisis, ended well over 4 years ago.
In May, Mr. Bernanke said that the Fed might change policies in the coming months by paring back or “tapering” its monthly bond purchases. Interest rates rose in response to his comment, which in turn caused the stock and bond markets to decrease significantly. Bernanke responded by stating that the economy is still weak, so federal policies will still be needed for a while and no changes will take place for the time being. This helped cap rising interest rates and helped halt the flight of capital from emerging markets.
Currently, the Fed does not have a fixed schedule for withdrawing QE or raising interest rates. It’s not likely the Fed will pull its support for the market before the current problems in Washington are resolved. (Source: Kiplinger’s Economic Outlook, October 10, 2013)
Inflation
Inflation is low by virtually every measure and has dropped below the Fed’s target of 2.0%. (Source: Bob Le’Clair’s Finance & Markets Letter, September 28, 2013) Although inflation appears to be tame at this time, this number does not include energy, food or healthcare costs.
Also keep in mind that although inflation hasn’t been much of a worry in recent years, even a modest amount will nibble away at your portfolio over time. Stocks don’t always beat inflation over short periods, especially when it’s caused by sudden spikes in oil or other commodity prices. But over the long haul, stocks are a powerful defense. Based on data going back to 1926, Morningstar’s Ibbotson unit reports that long-term bonds have historically returned only 2.6% annualized after inflation, compared to large-company stocks which have delivered close to 7%. (Source: Kiplinger’s Personal Finance, April 2013)
Unemployment
Thanks to the government shutdown, doors were closed doors at the Department of Labor, so the vital September employment report was not issued. However, the information we have through August shows that progress rebuilding labor markets is extremely slow and disappointing. (Source: Department of Labor)
The monthly job creation is averaging just 180,250, below the pace set in 2012 and well under the steady 200,000 a month that would signal a healthy economy. A total of about 2.1 million jobs will be created by year-end, which is little change from 2012. Prospects for next year don’t look much better, with an estimated net gain of about 2.25 million jobs over the course of the year and the unemployment rate of about 7.2% by year-end 2014. There are still about 2 million fewer jobs now than when the recession began in 2007. Including part-time workers looking for full-time work and people who have received the maximum unemployment benefit and dropped off, the records brings the unemployment numbers up to between 15-22%.
 Price/Earnings Ratio
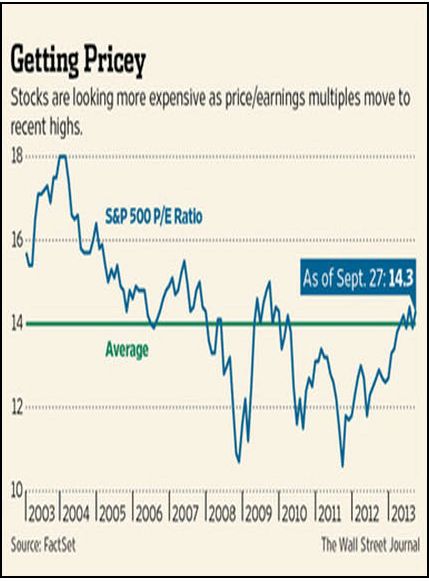
Stocks moved further into record territory in the third quarter before giving up some of their gains. The Fed’s pledge to keep current interest rates low indefinitely caused money to keep flowing out of low-yielding less risky investments such as government bonds and bank accounts and into alternatives such as the stock market. However, the bull market’s momentum has slowed lately, as rising valuations have prompted more investors to start selling some of their portfolio and rebalancing their current holdings.
Stocks have gotten pricier in recent months. The S&P 500 is trading at a price/earnings ratio of 14.3 times the next 12 months’ worth of earnings, which is above the average of 12.9 for the past 5 years and 14.0 for the past 10 years, according to FactSet. Many economists say the slow pace of corporate earnings growth has been inflated by stock buybacks, which has the effect of lifting earnings-per-share readings even when underlying sales growth remains soft. While some economists see stocks moving into dangerous territory, others predict we are still part of a bull market that still has legs.
According to many economists, with the uncertainty surrounding interest rates, bonds are now riskier than stocks. The values in stocks are currently better. As bond yields rise, bond prices fall. For example, consider that a 1-percentage point rise in interest rates will cause a 30-year Treasury bond to fall by 17%. For now, bond holders can expect to earn whatever they collect in interest, with little or no price appreciation—which means returns in the low single digits. That compares with a likelihood of high single digits (and possibly more) from stocks. For income investors, dividend-paying stocks are an enticing alternative to bonds—the 2.2% average yield on the S&P 500 stocks is about the same as the current yield on 10-year Treasuries. Many high quality companies are offering dividend yields well above the yields of their own bonds. In addition, although there are no guarantees, the appreciation potential on stocks is still greater over the long run if it is a good quality company.
Bonds are still a vital part of a diversified portfolio. During a period of rising interest rates, instead of avoiding bonds entirely, a more thoughtful strategy would be to adjust your exposure to bonds based upon their actual duration.
International Markets
Global trade and investment push more than $50 trillion annually to the world’s financial markets—a figure that more than triples the size of the U.S. economy. This figure exceeds even the annual trading volume in U.S. government securities, the largest and most active market in the world. The stalemate in Washington has caused global stock markets to slide, although many traders stress that conditions across financial markets remain calm. The third quarter was actually a good one for European stock markets, with the STOXX Europe gaining 8.9% compared to only 4.7% for the S&P 500. Despite investors’ general skepticism about Europe, Bob Baur, Chief global economist at Principal Global Investors, says he has been taking advantage of the market’s recent weakness to buy stocks that should perform well in the strengthening economy. (Source: Forbes, October 7, 2013)
Unfortunately, there was a major upset in the global markets that began with China’s decision to promote its exports by keeping the value of its currency, the Yuan, cheap to the dollar. When Chinese goods are cheap in global markets, foreigners buy them and create a huge demand for the Yuan. Despite the financial debt crisis in Europe and the turmoil in U.S. markets over the past few years, China’s economy has continued to register strong growth, with an annual growth rate of 10%. It is now the second largest economy in the world and China is the world’s largest exporter and second-largest importer. These transactions have averaged a staggering $800 billion per year during the last 10 years and increased China’s official U.S. dollar holdings at an annual rate of 31%. Beijing currently has amassed a reserve of more than $3 trillion. (Source: World Economic Database. International Monetary Fund website, reference 2011)
Other export-oriented emerging countries have also followed variations of this policy by keeping their currencies cheap against the dollar and amassing large reserves. Changes within these countries regarding their financial decisions are often the cause of the global economic upset, which we experience on a regular basis. The problem is that these excess savings have interfered with the normal flow of the boom-bust cycles, and therefore fostered above-average global volatility due to the size and independent nature of the liquidity flows.
Many economies, especially the emerging markets, are concerned about the U.S. Federal Reserve. If the Fed scales back stimulus efforts, it could be harder for these countries to obtain the dollars they need. However, if current trends continue, these emerging economies could rival the U.S., and China may soon overtake us. The International Monetary Fund (IMF) projects that in 3 years America’s share of world GDP could fall to 17.7%, less than China’s share. (Source: The Misrule of Law in America)
“Obamacare”
“Obamacare” is the most ambitious shake-up of America’s health care system since the 1960s. There are an estimated 55 million, or 1 in 7, people in the United States without health insurance. Starting January 1, 2014, these people will be required to buy insurance or pay a fine. Those who cannot afford it will receive subsidies; part of a big expansion of coverage to the sick and the poor.
The success or failure of this program in the coming months will be influenced by people signing up for health care exchanges, the types of plans they select, and their actual health experience. Democrats believe “Obamacare” can move the country toward universal coverage while keeping costs down. However, Republicans argue that you cannot extend health insurance coverage to 55 million additional people while simultaneously improving the quality of care and lowering costs. They view it as unaffordable, socialized medicine.
One of the biggest problems with America’s system is that insurers have long charged extremely high rates to the sick, or refused to cover them at all in many circumstances. Starting in January, this practice will be banned. Since insurers would soon go bankrupt if they sold only cheap plans to sick patients needing expensive treatment, “Obamacare” pushes the young and fit to buy insurance, too. This will give insurers revenue from cheap, healthy patients to offset the cost of insuring sick ones.
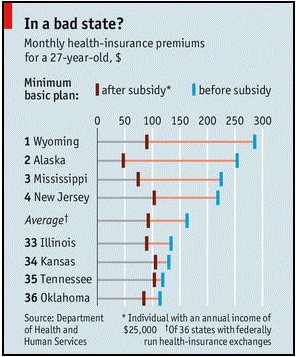 The cost of insurance will vary significantly and requires insurers to cover a minimum set of services. In most states, the simplest plans will become more comprehensive. Because there are many variables, “Obamacare” will have dramatically different effects from place to place and person to person. The law will raise health costs for some and lower them for others. For example, a 27 year old will pay $130 a month for a basic plan in Kansas, compared with $286 in Wyoming (see chart.) (Source: The Economist, October 5, 2013)
Overhauling America’s $2.7 trillion health sector is no easy task. America spends 18% of GDP on healthcare. The people of Britain, Norway, and Sweden, to name a few, spend half as much but actually live longer. Health spending is growing faster than wages, and is set to hit 20% of GDP by 2022, according to the Congressional Budget Office (CBO). The CBO states health costs remain the biggest long-term threat to America’s finances.
Public support is fragile—only 39% of Americans support “Obamacare”, while 51% disapprove, according to a recent poll by the New York Times and CBS. However, 56% would rather try to make the law work than stop it by stripping it of cash. Whether we eventually judge “Obamacare” a success or a catastrophe, only time will tell.
Conclusion
The 5 words going through every investor’s mind at this point: “What should I do now?”
The daily economic headlines are depressing and there is widespread fear that the combination of an aging population and pressures to embrace fiscal growth will weigh heavily on the economy. However, these fears tend to overshadow how much progress households are making in restoring their balance sheets. For example, balances on credit cards in the second quarter of 2012 were 22.4% below their peak in the fourth quarter of 2008, according to the Federal Reserve Bank of New York. That means Americans are saving again. The personal savings rate is now 4.2%, well above the low of 1% reached in April 2005.
Widespread fear of the consequences of the shutdown and the debt-ceiling debate may drive many investors to dump stocks and other risky assets, as they did during the last debt ceiling standoff in August 2011. You may want to buckle your seatbelt. However, now is not the time to completely overhaul your strategy, “It’s folly to try and Washington-proof your portfolio,” said Doug Cote, chief investment strategist at ING U.S. Investment Management. “This kind of thing can turn on a dime and the market can go up a lot faster than it goes down. So if you sell now, you’re just locking in losses.”(Source: Investment News, October 7, 2013)
As an investor, you can stay up all night worrying about what could happen, or you can simply focus on managing your portfolio for the long term. Make sure you have a well-diversified portfolio that can weather the corrective periods of the stock market cycle. Long term, stocks will usually reward investors for putting up with the short-term worries.
Remember the old rule of thumb, “Never waste a crisis!” Your investing behavior and choices can actually have a greater effect on your overall rate of return than the performance of your investments. History shows us that investors lose far more money as a result of their actions than markets lose for them.
P.S. Look in the mirror. History shows us that investors lose far more money as a result of their own actions than markets lose for them.
Note: The views stated in this letter are not necessarily the opinion of FSC Securities Corporation, and should not be construed, directly or indirectly, as an offer to buy or sell any securities mentioned herein. Investors should be aware that there are risks inherent in all investments, such as fluctuations in investment principal. With any investment vehicle, past performance is not a guarantee of future results. Material discussed herewith is meant for general illustration and/or informational purposes only, please note that individual situations can vary. Therefore, the information should be relied upon when coordinated with individual professional advice. This material contains forward looking statements and projections. There are no guarantees that these results will be achieved. There is no guarantee that a diversified portfolio will outperform a non-diversified portfolio in any given market environment.
Due to volatility within the markets mentioned, opinions are subject to change without notice. Information is based on sources believed to be reliable; however, their accuracy or completeness cannot be guaranteed.
Indexes cannot be invested in directly, are unmanaged and do not incur management fees, costs or expenses. No investment strategy, such as asset allocation and rebalancing, can guarantee a profit or protect against loss in periods of declining values.
In general, the bond market is volatile, bond prices rise when interest rates fall and vice versa. This effect is usually pronounced for longer-term securities. Any fixed income security sold or redeemed prior to maturity may be subject to a substantial gain or loss. The investor should note that investments in lower-rated debt securities (commonly referred to as junk bonds) involve additional risks because of the lower credit quality of the securities in the portfolio. The investor should be aware of the possible higher level of volatility, and increased risk of default.
The payment of dividends is not guaranteed. Companies may reduce or eliminate the payment of dividends at any given time.
International investing involves special risks including greater economic and political instability, as well as currency fluctuation risks, which may be even greater in emerging markets.
The price of commodities is subject to substantial price fluctuations of short periods of time and may be affected by unpredictable international monetary and political policies. The market for commodities is widely unregulated and concentrated investing may lead to higher price volatility.
Sources: Wall Street Journal (9/30/13, 10/5/13, 10/9/13), Barron’s (10/8/13), Kiplinger’s Economic Outlook (10/10/13), Bob LeClair’s Finance (9/28/13), The Economist (10/5/13), Investment News (10/7/13)
Contents Provided by MDP, Inc. Copyright 2013 MDP Inc.
